Statistics
13-41
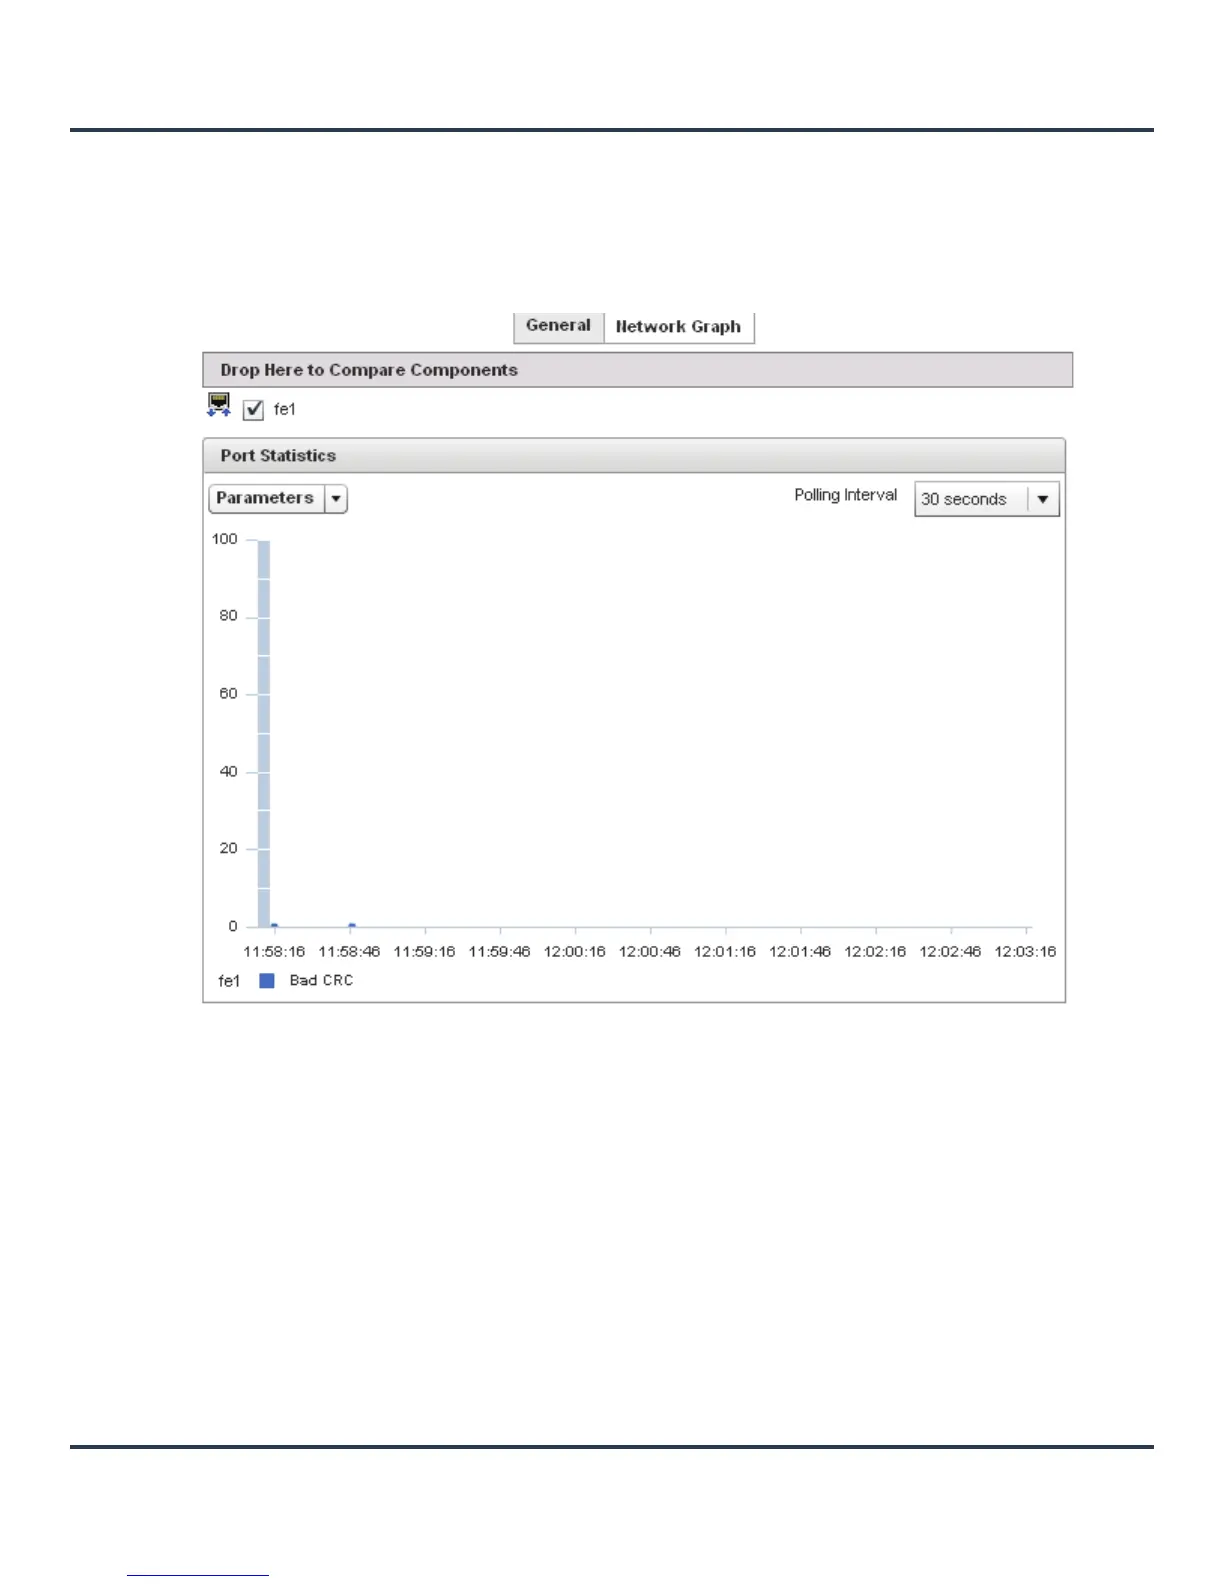
13.3.9.2 Viewing Interface Statistics Graph
Interfaces
The Network Graph tab displays interface statistics graphically. To view a detailed graph for an interface,
select an interface and drop it on to the graph. The graph has Port Statistics as the Y-axis and the Polling
Interval as the X-axis. Select different parameters on the Y-axis and different polling intervals as needed.
Figure 13-25 Access Point Interface - Network Graph tab
13.3.10 Network
Access Point Statistics
Use the Network screen to view information for ARP, DHCP, Routing and Bridging. Each of these screen
provide enough statistics to troubleshoot issues related to the following four features:
• ARP Entries
• Route Entries
• DHCP Options
 Loading...