PART 2: CX-Server PLC Tools
OMRON CHAPTER 5 – Data Trace/Time Chart Monitor Component
CX-Server PLC Tools_ Page 65
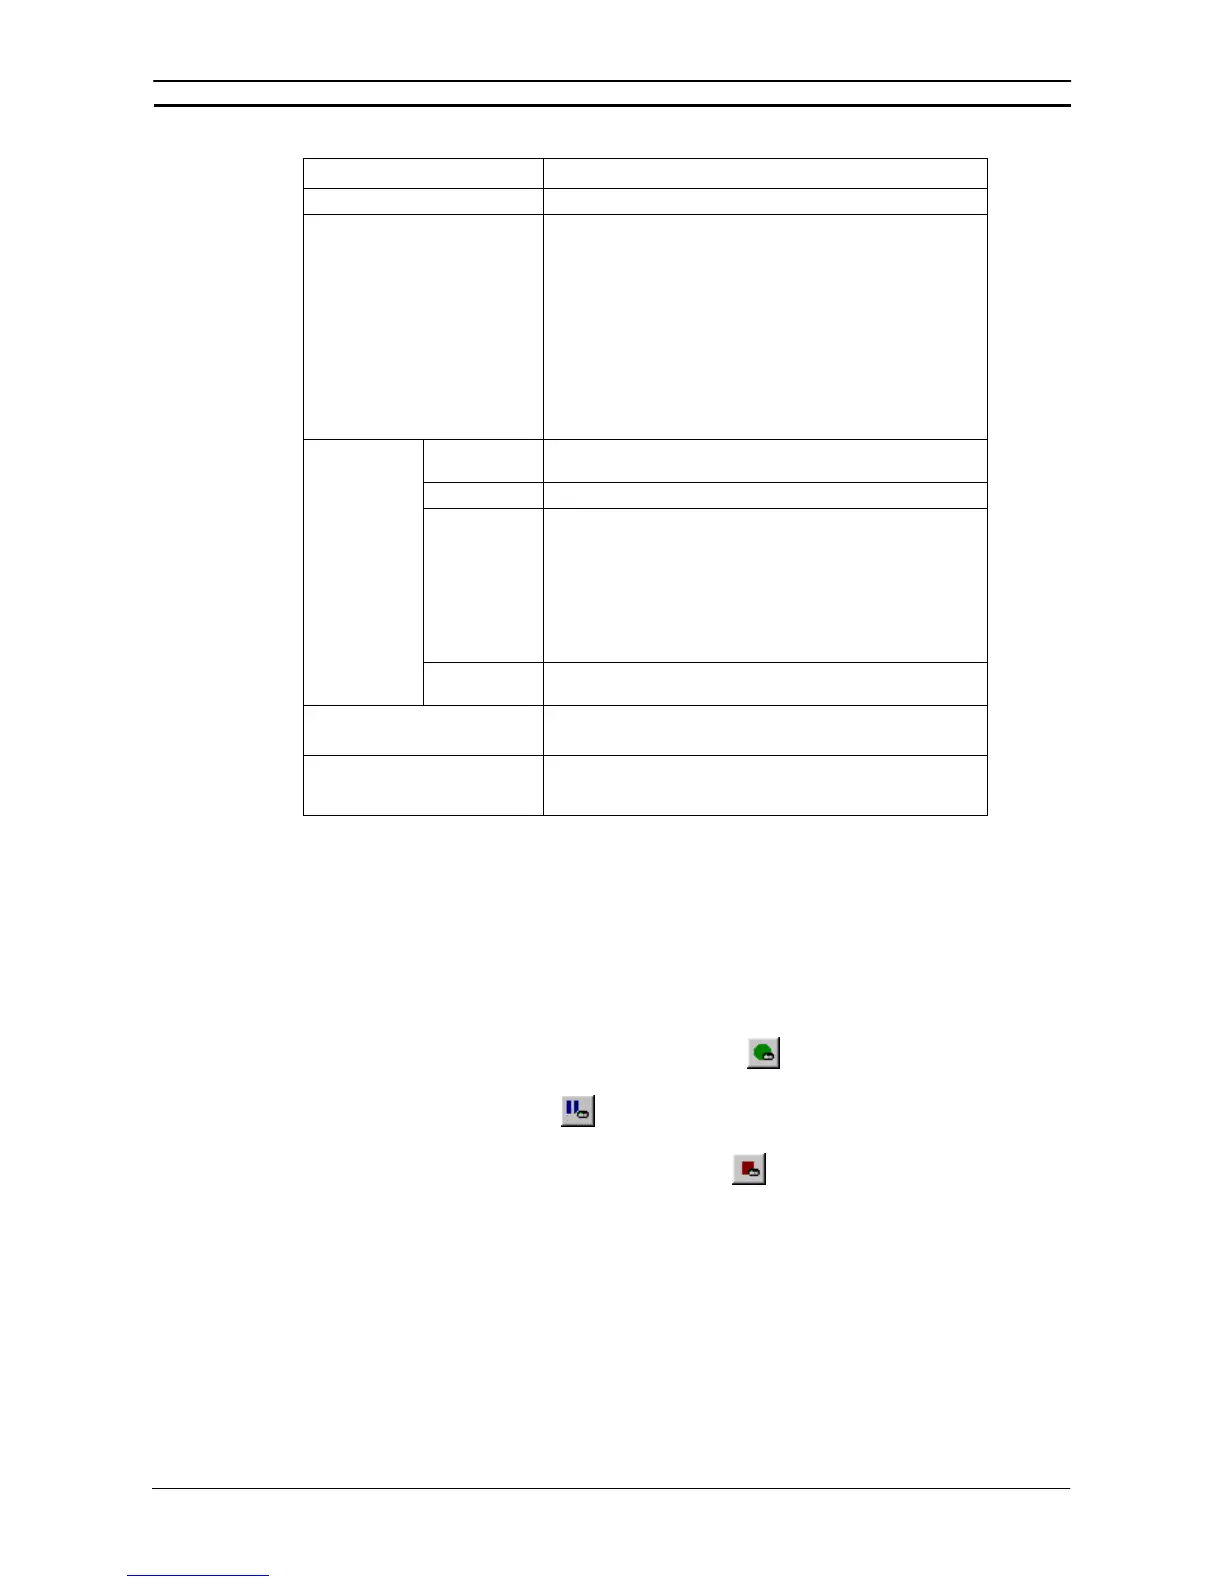
Item Function
[Trace Type] Select [Trace].
[Sampling Setting] Select the sampling conditions of Time Chart Monitor.
[Fixed Interval]
Sampling with fixed intervals. Set sampling cycle in milliseconds.
I/O data per sampling cycle is sampled.
[Buffer Size]
Operate sampling with the specified sample number. The old
sampling data will be destroyed automatically.
[Stop When Buffer is Full]
Check on the box. Sampling will stop when the set buffer size is
reached.
[Left Operand] Input Symbol for trigger object or the address. Select data type
from Combobox.
[Browse] Search trigger objects from Symbol Table.
[Formula] Select the conditions of trigger completion.
[Left Operand] is a bit (data type is BOOL):
↑ Falling Edge
↓ Rising Edge
[Left Operand] is other than the above:
= Equal
[Trigger
Settings]
[Right
Operand]
Input the value of trigger. Input is enabled when [Left Operand] is
except for a bit (data type is except for BOOL).
[Delay] Input delay value in sample number. Input in slider is possible.
[Trace Start Executing
Automatically After Download]
Check Box
Check on the box to start Time Chart Monitor automatically after
transferring the execution conditions of Time Chart Monitor to
PLC.
Settings on [Trace Object] Tab
Set the object of Time Chart Monitor. The operation procedure is as same as the one on the previous topic:”
Parameter Settings of Data Trace for CS/CJ/CP”. Refer to settings on [Trace Object] tab on the previous topic.
Execute Time Chart Monitor with Data Trace Window for CS/CJ/CP
Execution operation of Time Chart Monitor will be discussed. Parameter settings are necessary prior to executing
Time Chart Monitor.
Operation of Time Chart Monitor
1 Select [Operation]| [Execute] on Data Trace Window (or click on ). Time Chart Monitor screen will
appear in Data Trace window.
Select [Operation]| [Trigger] (or click on
) and trigger completion can be done.
2 Sampling starts when trigger conditions are completed.
Select [Operation]| [Stop] to stop Time Chart Monitor (click on
).
3 In case that [Sampling] tab| [Stop When Buffer is Full] is checked in [Time Chart Monitor Configuration]
dialog box, sampling automatically stops when buffer is full and Time Chart Monitor screen stops.
Refer to the previous topic: “Parameter Settings of Time Chart Monitor” for [Time Chart Monitor
Configuration] dialog box.