PART 2: CX-Server PLC Tools
CHAPTER 5 – Data Trace/Time Chart Monitor Component OMRON
CX-Server PLC Tools_Page 66
Convenient Functions of Data Trace Window for CS/CJ/CP
Show Cursor/Trigger Position
♦ Select [Option]| [Measure]| [Value] on menu or click on
on tool bar. The value will be displayed. The
value of X axis (time axis) on cursor position will appear at the bottom of graph. The value of Y axis (present
value axis) will appear on Legend.
Change of cursor position is possible with dragging cursor.
To show the value on the point of the specified time axis, input the value into
on tool bar and
press [Enter] key or click on
on tool bar.
♦ Select [Options]| [Measure]| [Difference] on menu or click on
on tool bar. Measure Difference will
appear. Each value on X axis (time axis) of two cursors and the difference value will appear at the bottom of
graph. Each value on Y axis (present value axis) and difference value will appear on Legend.
Dragging each cursor or located on the top of cursor enables to change each cursor position separately.
Dragging located between two cursors enables to change cursor position while the interval of the two is kept.
♦ A value cursor is displayed on the trigger position. The values on the X axis (time axis) and Y axis (present
value axis) of the trigger position are displayed in the symbol list.
Zoom Select
♦ Select [View]| [Zoom Select] or click on
on tool bar. Zoom Select mode will be on. Select the graph area
to be enlarged by drag. The selected area only will be displayed on graph area. Only selected view will appear
on graph area when more areas to be enlarged are selected by drag. This operation is executable repeatedly.
♦ Select [View]| [Zoom Unselect] on menu or click on
on tool bar. The enlarged view after Zoom Select
will return to the previous one. To return the status prior to Zoom Select mode, select [View]| [Zoom Fit] or
click on
on tool bar.
For C/CV-series
Setting Monitoring Conditions
The Data Trace or Time Chart Monitor must be activated before the settings can be configured. To select Data
Trace or Time Chart Monitoring mode, select the Mode option from the Operation menu followed by either Data
Trace or Time Chart Monitor.
Note: The mode of the Data Trace/Time Chart monitor component is identified prior to
activation from the invoking application.
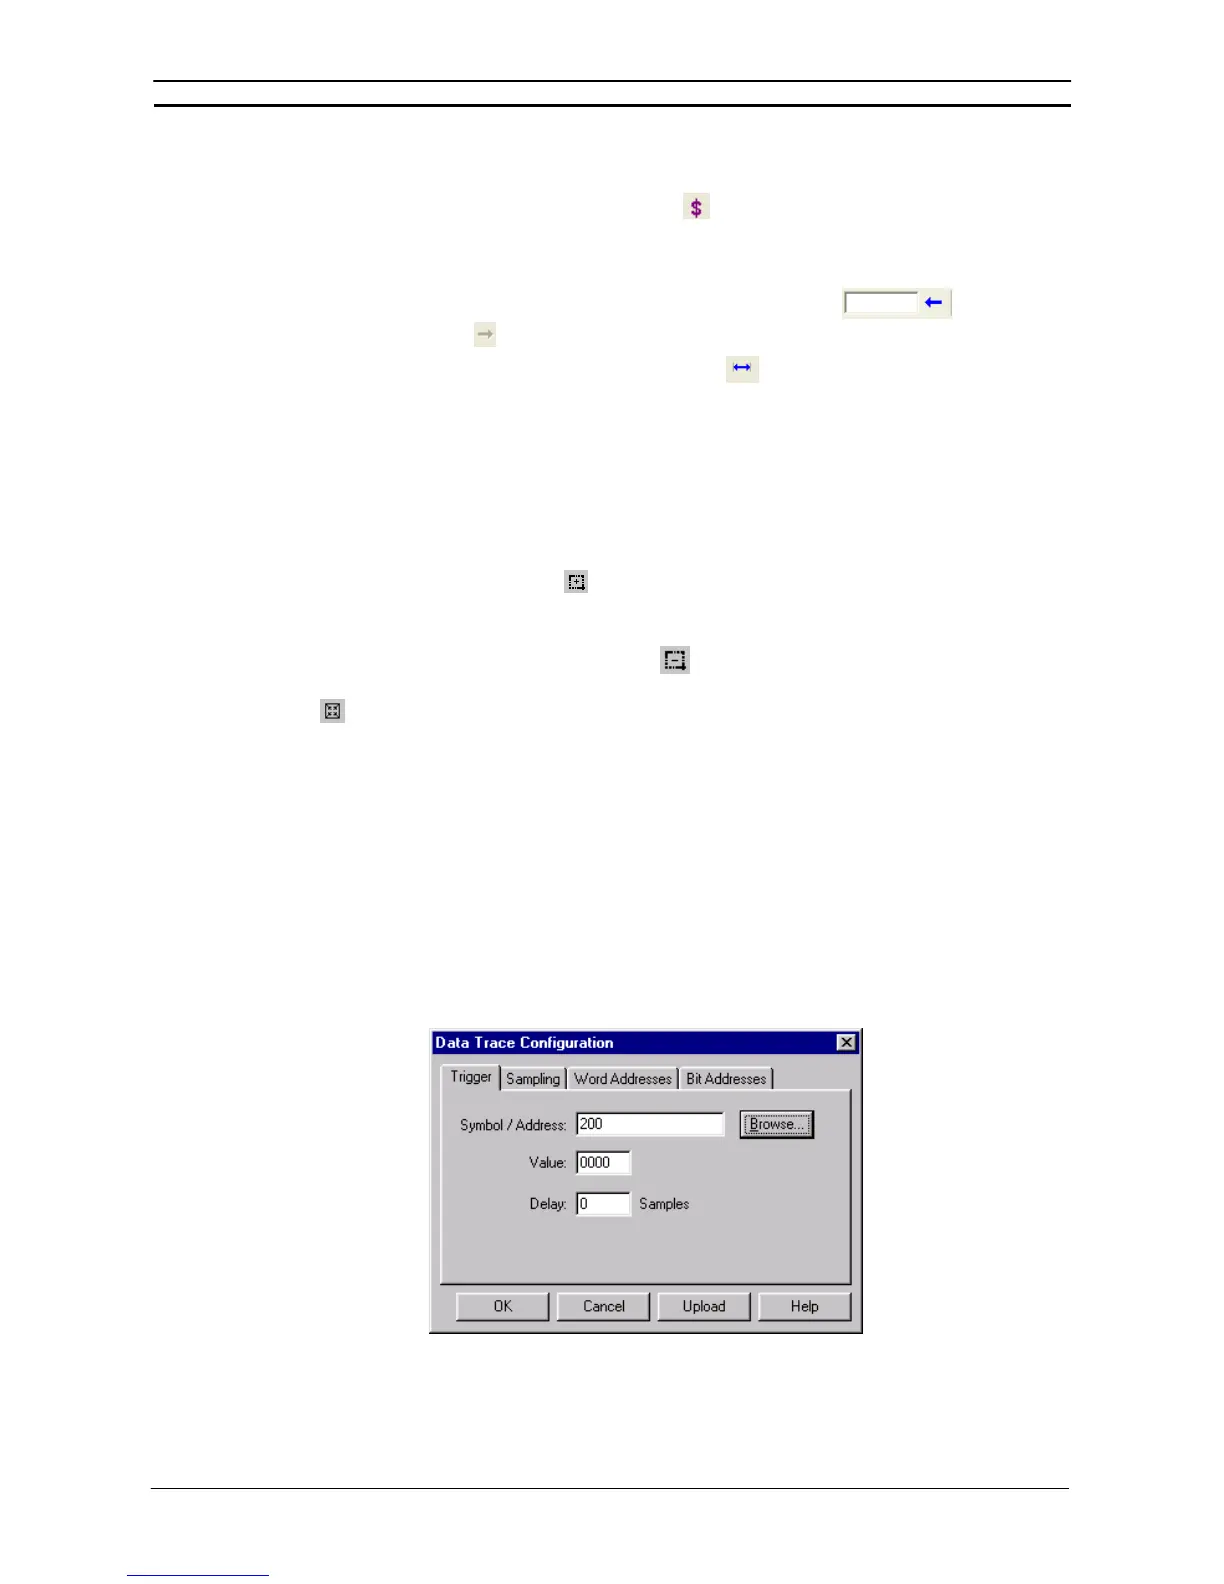
The Time Chart Monitor/Data Trace Configuration dialog allows the conditions for the Data Trace or Time Chart
Monitor to be set, i.e. specifying the data to be monitored, the intervals at which this is to occur and the trigger
conditions.
Use the following procedure to set conditions for the Data Trace or Time Chart Monitor modes.
1, 2, 3…
1. Select the Configure Trace/Time Chart button from the toolbar.