Scan Tool User Guide 43
Datastream Functions
7: Datastream
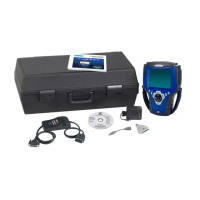
About Graph Display
If a selected line’s data reading is a number (usually
a sensor reading), you can use the Graph function
key to display the line’s data as a graph. For exam-
ple, see Figure 7.6
and Figure 7.7. Notice how the
function key changes to Analog so you can change
the display to Analog (see the next section).
NOTE: The function key toggles from Graph to Analog to
Digital and back to Graph.
Figure 7.6: Datastream Screen - Digital Display
Figure 7.7: Datastream Screen - Graph Display
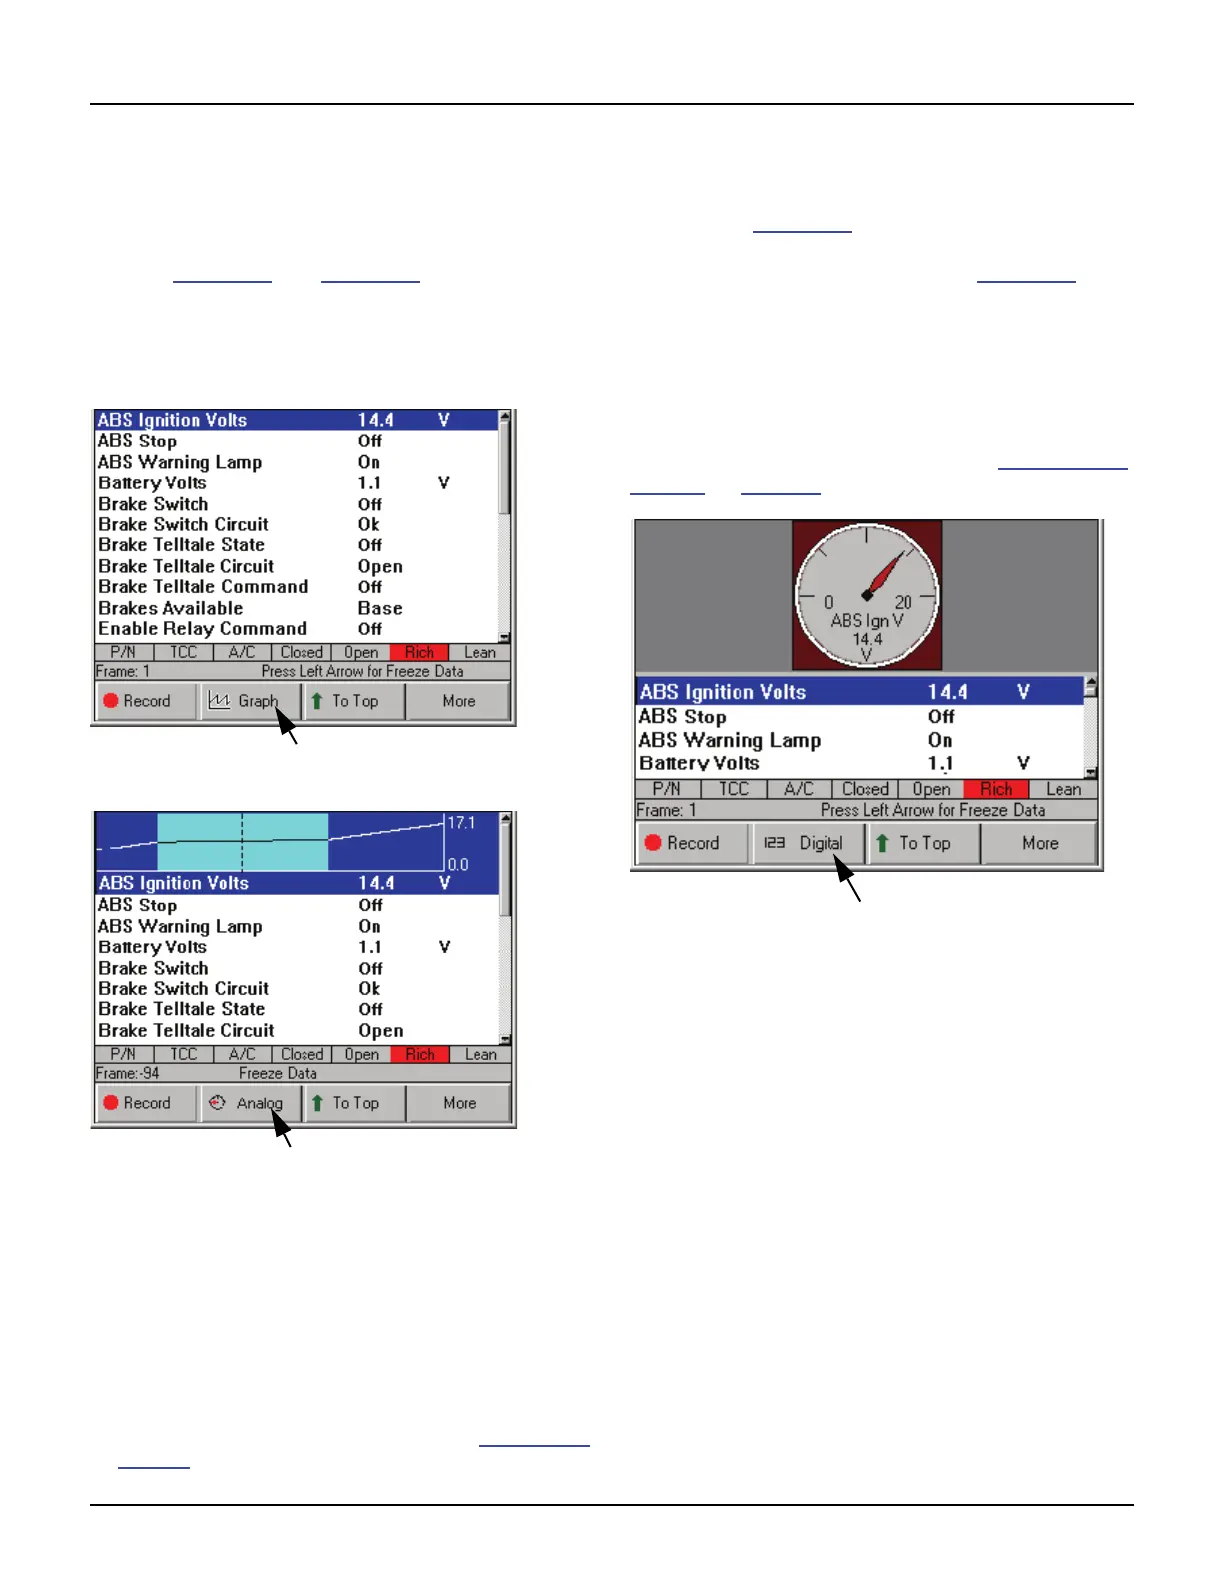
The graph has a past activity section and a magnified
live activity window. The minimum and maximum
measurements appear to the right of the graph and
the digital reading is below the graph. For some
sensors, an average reading appears between the
minimum and maximum measurements (not shown).
The average reading can be useful in spotting data
trends.
NOTE: You can use the Left and Right Direction keys to
view past data in the magnified window. See Freeze Data
on page 45
.
About Analog Display
When a selected line’s data reading is displayed as
a graph (seeFigure 7.7
), you can use the Analog
function key to display the line’s data as an Analog
gauge at the top of the screen (see Figure 7.8
).
When you display the gauge, the Digital data line
remains displayed in its normal position in the list.
Also, the function key changes from Analog to Digital
so you can change the display to back to Digital only.
You can display up to three gauges at the top of the
screen. When gauges are displayed, you can tempo-
rarily “hide” them. For details, refer to Show / Hide
Analog on page 49.
Figure 7.8: Datastream Screen - Analog Display