EGM-5 Operation Manual V. 1.04 59 support@ppsystems.com
Pulses on and off to indicate that the system is powered on (power
status).
Percentage of battery life remaining (%).
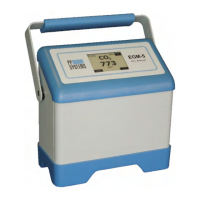
Current measurement of CO
2
Concentration (ppm).
Delay is the countdown in seconds from x to 0, where x is the Delay
value specified in SRC – Termination Settings (Step 3). CAL is the active
CO
2
concentration calculating phase. END indicates calculations have
2
concentration (ppm) from time = 0 seconds.
Elapsed time (seconds) for the current session (i.e., change in time).
Linear respiration rate (g m
-2
hr
-1
).
Quadratic respiration rate (g m
-2
hr
-1
).
Plot number defined by user in SRC – Other Settings (Step 4).
dC (change in CO
2
concentration)(ppm)
Maximum positive change in CO
2
concentration (ppm) allowed in a given
session. This value is defined in SRC – Termination Settings (Step 3).
Maximum time for which changes in the chamber CO
2
monitored in a given session. This value is defined in SRC – Termination
Stops the SRC process and returns to SRC – Other Settings (Step 4).
Only the individual CO
2
measurements are saved to the USB flash drive.
Process data is discarded.
Any information or error messages are displayed here.
Stops the SRC process and returns to SRC – Other Settings (Step 4).
Results are saved to the USB flash drive.
The measurement sequence will terminate when the maxDC or maxDT is reached. If maxDT is reached
first, the message “Time limit” will appear in the status box. If maxDC is reached first, the message “CO2
limit” will appear in the status box.
For more information on the theory and calculation of soil respiration/canopy assimilation, please refer to
Appendix 1. Soil CO
2
Efflux and Net Canopy CO
2
Flux on page 124.
CPY (Canopy Assimilation Chamber) Process
This process is used in conjunction with our CPY-5 Canopy Assimilation Chamber for measurement of
closed-system net canopy CO
2
flux. In the CPY process, the assimilation rate (μmol m
-2
s
-1
) is calculated
by measuring the rate of change (decrease) in the chamber CO
2
concentration. The EGM-5 calculates
both a linear fit and a quadratic fit to the measured data. The data is checked in the quadratic fit to
determine if the data is linear.
While the EGM-5 is in the CPY measurement mode, additional data is added to the output data string:
change in CO
2
(dC), process time (dT), Linear respiration rate (L), and Quadratic respiration rate (Q).