4.2 Identifying optimal object position
66
67
68
69
70
71
72
73
74
0 500 1000 1500 2000 2500
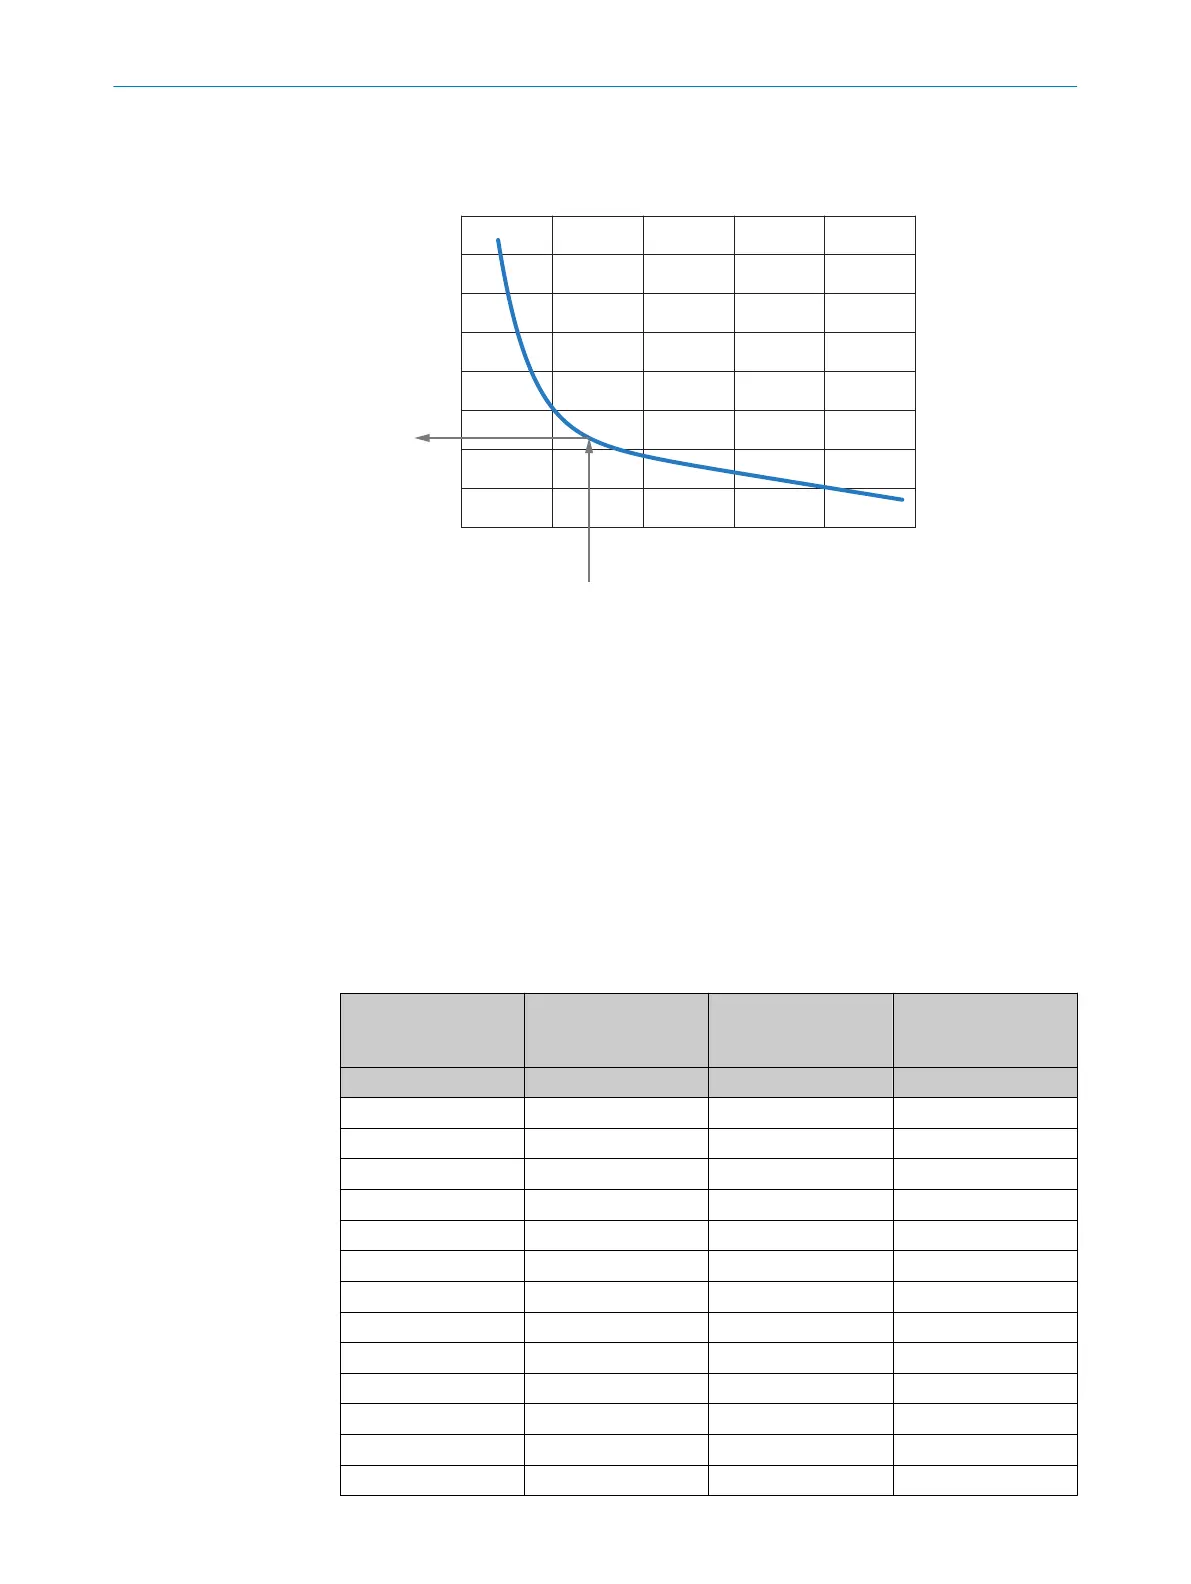
Optimale Objektposition (optimaler Abstand Objekt – Sender) in %
Abstand Sender – Empfänger in mm
68,3 %
700 mm
1
2
Figure 19: Identifying optimal object position - example
1
Planned distance between sender and receiver
2
Result for the optimal object position
Identifying optimal object position
1. S
elect the planned distance between sender and receiver in the diagram.
Example: 700 mm
2. Identify optimal object position using the diagram.
Example: 68.3%
3. Convert optimal object position in mm.
Example: 0.683 x 700 mm = 478.1 mm
4. If needed, calculate the optimal distance of the object to the receiver.
Example: 700 mm – 478.1 mm = 221.9 mm or (1 – 0.683) x 700 = 221.9 mm
Table 12: Optimal object position: Optimal distance between object and sender
Distance between
sender and rec
eiver
Optimal distance
between object and
sender
Optimal distance
between object and
sender
Optimal distance
between object and
receiver
[mm] [%] [mm] [mm]
200 73.4 146.8 53.2
250 72.1 180.3 69.7
300 71.1 213.3 86.7
400 69.8 279.2 120.8
500 69.1 345.5 154.5
600 68.6 411.6 188.4
700 68.3 478.1 221.9
800 68.1 544.8 255.2
900 68.0 612.0 288.0
1000 67.8 678.0 322.0
1100 67.7 744.7 355.3
1200 67.7 812.4 387.6
1300 67.7 878.8 421.2
4 PLANNING
26
O P E R A T I N G I N S T R U C T I O N S | MLG-2 WebChecker 8025190/2020-01-13 | SICK
Subject to change without notice