11.1.4 “Graphic display” area
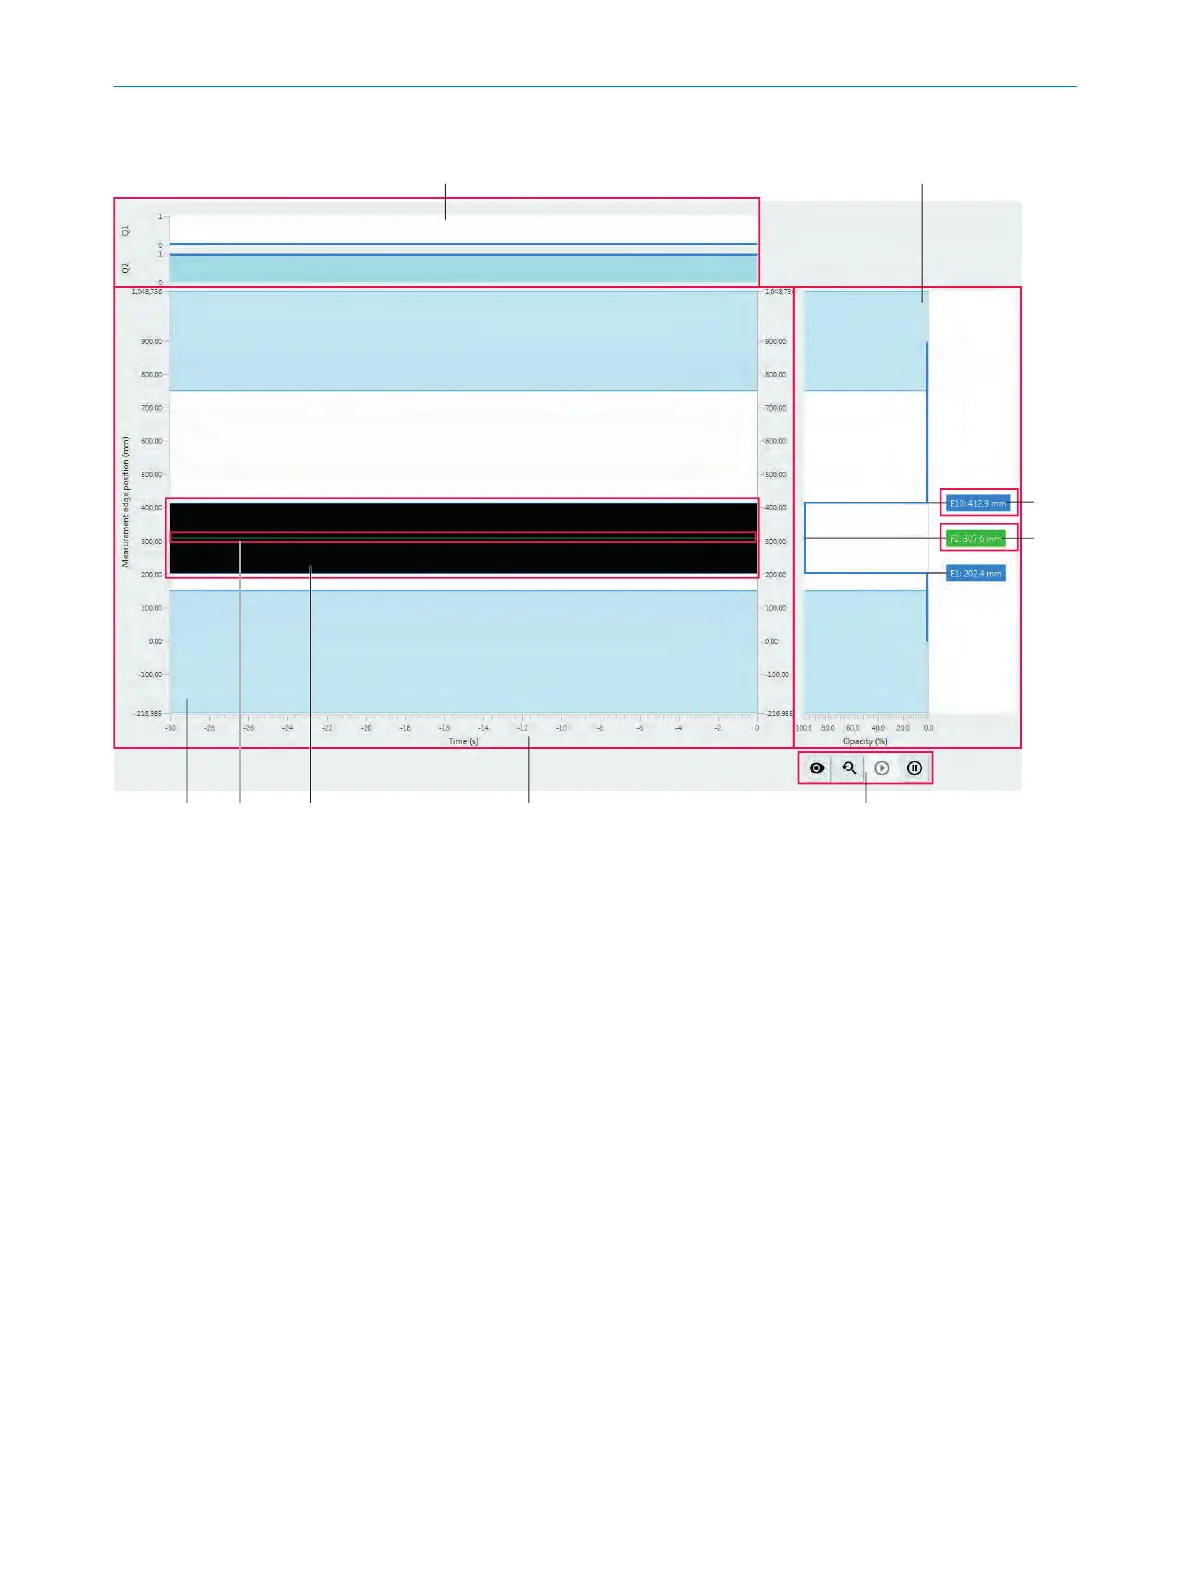
Figure 62: “Start” page, “Graphic display” area
1
Histogram for the Q switching outputs and inputs. You can parameterize this
ar
e
a using button 5 by selecting and de-selecting switching outputs in the
perimeter of the display.
2
Current attenuation (opacity) in %
3
Current measured value and label of edge (marked in blue)
4
Calculated current value and designation of a center position defined here as
function 2 (here between edge 1 and edge 10) (marked in green)
5
Buttons for the graphic display
6
Histogram of object, edge and center positions
7
Detected and measured object (black surface, grayscale value according to
the attenuation of the object)
8
Center position between 2 edges (green line)
9
Blue surface from above / below: Blanked area
Center blue surface: Empty modules (not shown here)
Fields marked in blue
The f
ields marked in blue show the measured edges with edge number and dimension.
These fields and associated object are displayed as soon as the MLG-2 detects and
measures objects with edges.
CONFIGURATION WITH SOPAS 11
8025190/2020-01-13 | SICK O P E R A T I N G I N S T R U C T I O N S | MLG-2 WebChecker
89
Subject to change without notice