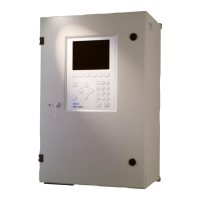
Fields marked in green
The f
ields marked in green show the calculated center positions between 2 edges. In
order to calculate values, you must parameterize the functions in the “Functional con‐
figuration” menu on the “Enhanced Sensing page see "“Functional configuration”
menu", page 101. The colors of the functions can be adjusted individually for a better
overview and differentiation.
Buttons for the graphic display
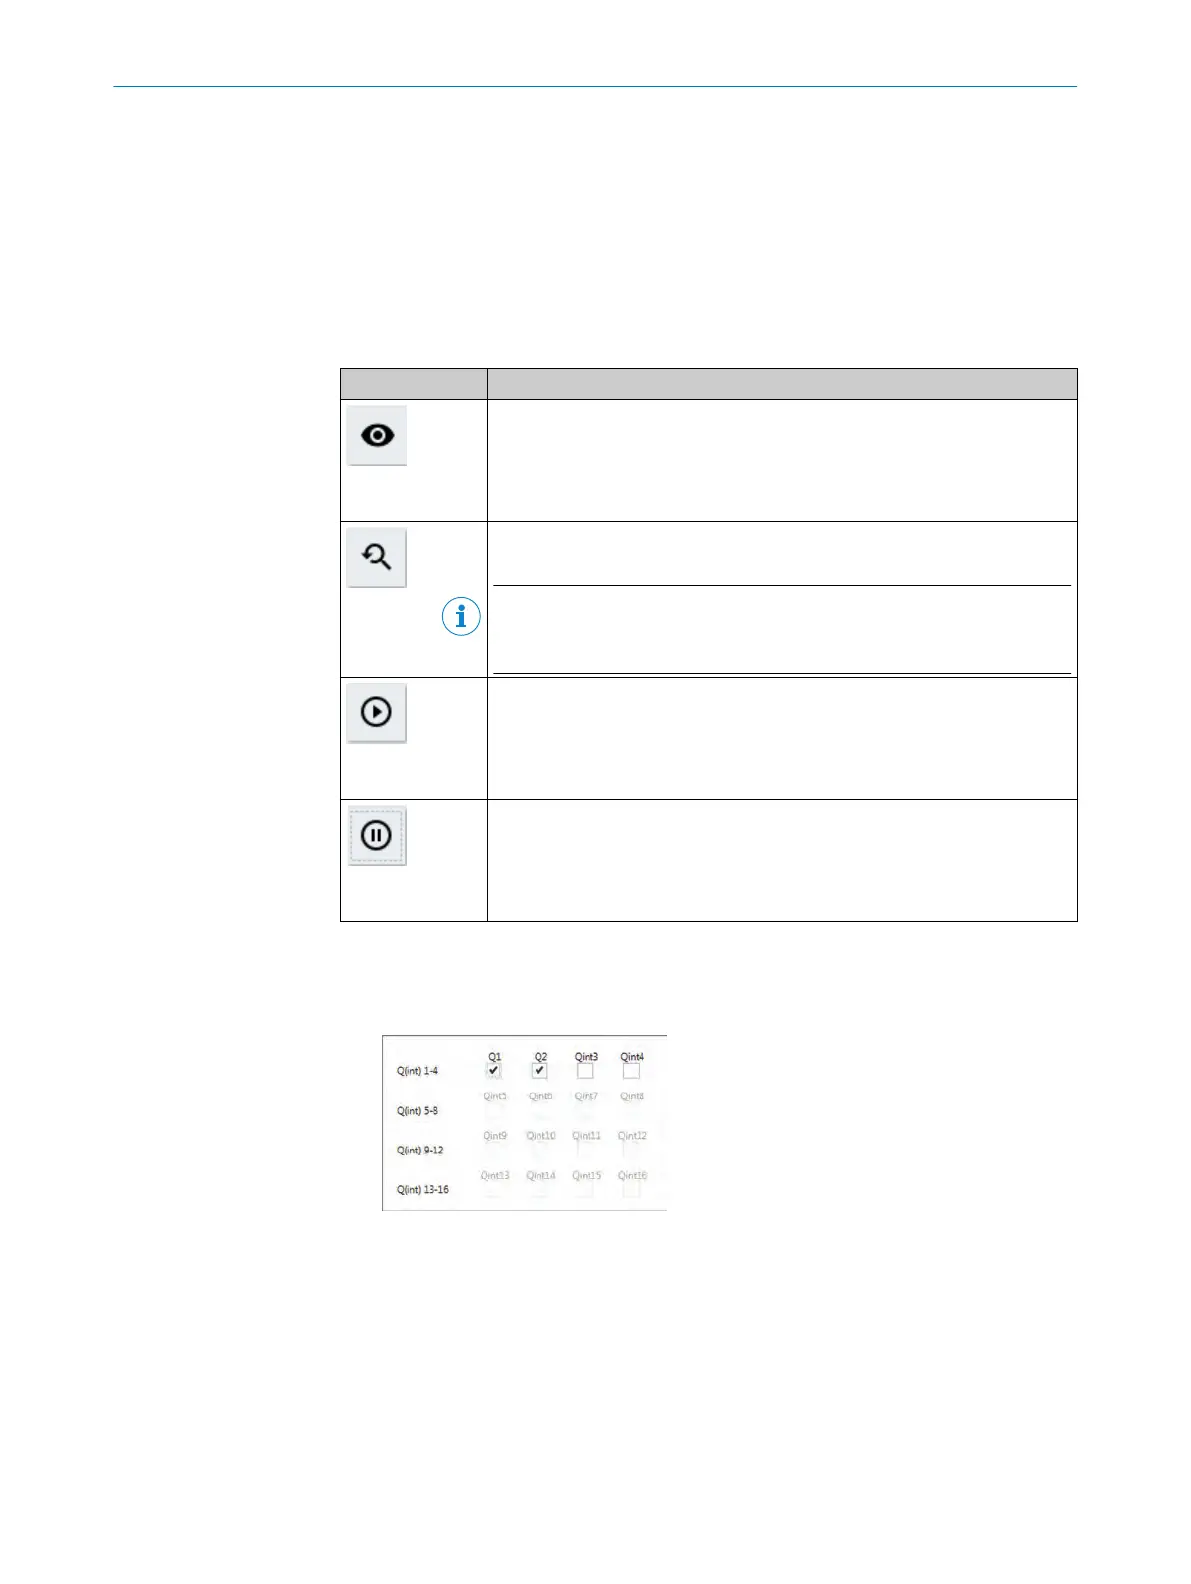
Table 43: Buttons
Button Description
(Eye)
Opens the window for configuration of the graphic display of the switching
out
put
s and inputs (see "Parameterizing “Switching output and inputs”
area", page 90).
(Magnifier)
Resets the zoom to the default. Also possible by double-clicking on the dia‐
gram.
NOTE
You c
an also zoom using the scroll wheel depending on the configuration of
your mouse.
(Play)
Starts temporal graphic display.
T
he but
ton is only active if the “Pause” button has been clicked.
(Pause)
Stops temporal graphic display.
Parameterizing “Switching output and inputs” area
1. Clic
k the “Eye” button.
✓
The following window opens. The display depends on the MLG-2 variant.
Figure 63: Histogram of switching output and input display/blanking
2. Activate the checkboxes for the switching output and inputs which are to be dis‐
pla
y
ed.
✓
The activated switching outputs and inputs are displayed graphically. If no switch‐
ing output or input has been activated, the area is not displayed.
11 CONFIGURATION WITH SOPAS
90
O P E R A T I N G I N S T R U C T I O N S | MLG-2 WebChecker 8025190/2020-01-13 | SICK
Subject to change without notice