12 Software description
CyFlow
®
Cube 8 | Operating Manual | May 2018 | Revision 032 161
Types of plots
The software can display four plot types:
Single Parameter Histogram Plots display the 1024 bin histogram for a
single parameter. The plot may be gated or ungated.
Dual Parameter Colour Density Plots are two dimensional 256 x 256
bin histograms which use colour to represent the level of events within
each bin. An algorithm is used to calculate the levels based on the
number of events. The levels have logarithmic intervals.
Six levels of colour are used for the Density Plots: Black for outlier
singles and, in order of increasing density: blue (lowest density), green,
yellow, orange and red (highest density).
Dual Parameter Colour Precedence Plots are two dimensional 256 x
256 bin dot plots which use colour to represent the gating events that fall
within specific gates. Where an event may be in multiple gates, the
precedence order determines which colour is chosen. Where events from
multiple gates fall within a single bin, the highest precedence gate colour
is chosen. Ungated events are displayed black. Precedence order can be
changed via the Precedence order dialogue (see chapter Gate group on
page 69).
Dual Parameter Precedence Density Plots are displayed as colour
precedence plots but include density information as well as colour
precedence.
Properties of individual plots, including changing of the plot type, can be
modified using the Plot Format tab of the Ribbon (see chapter 12.4.14 Plot
Format tab on page 124).
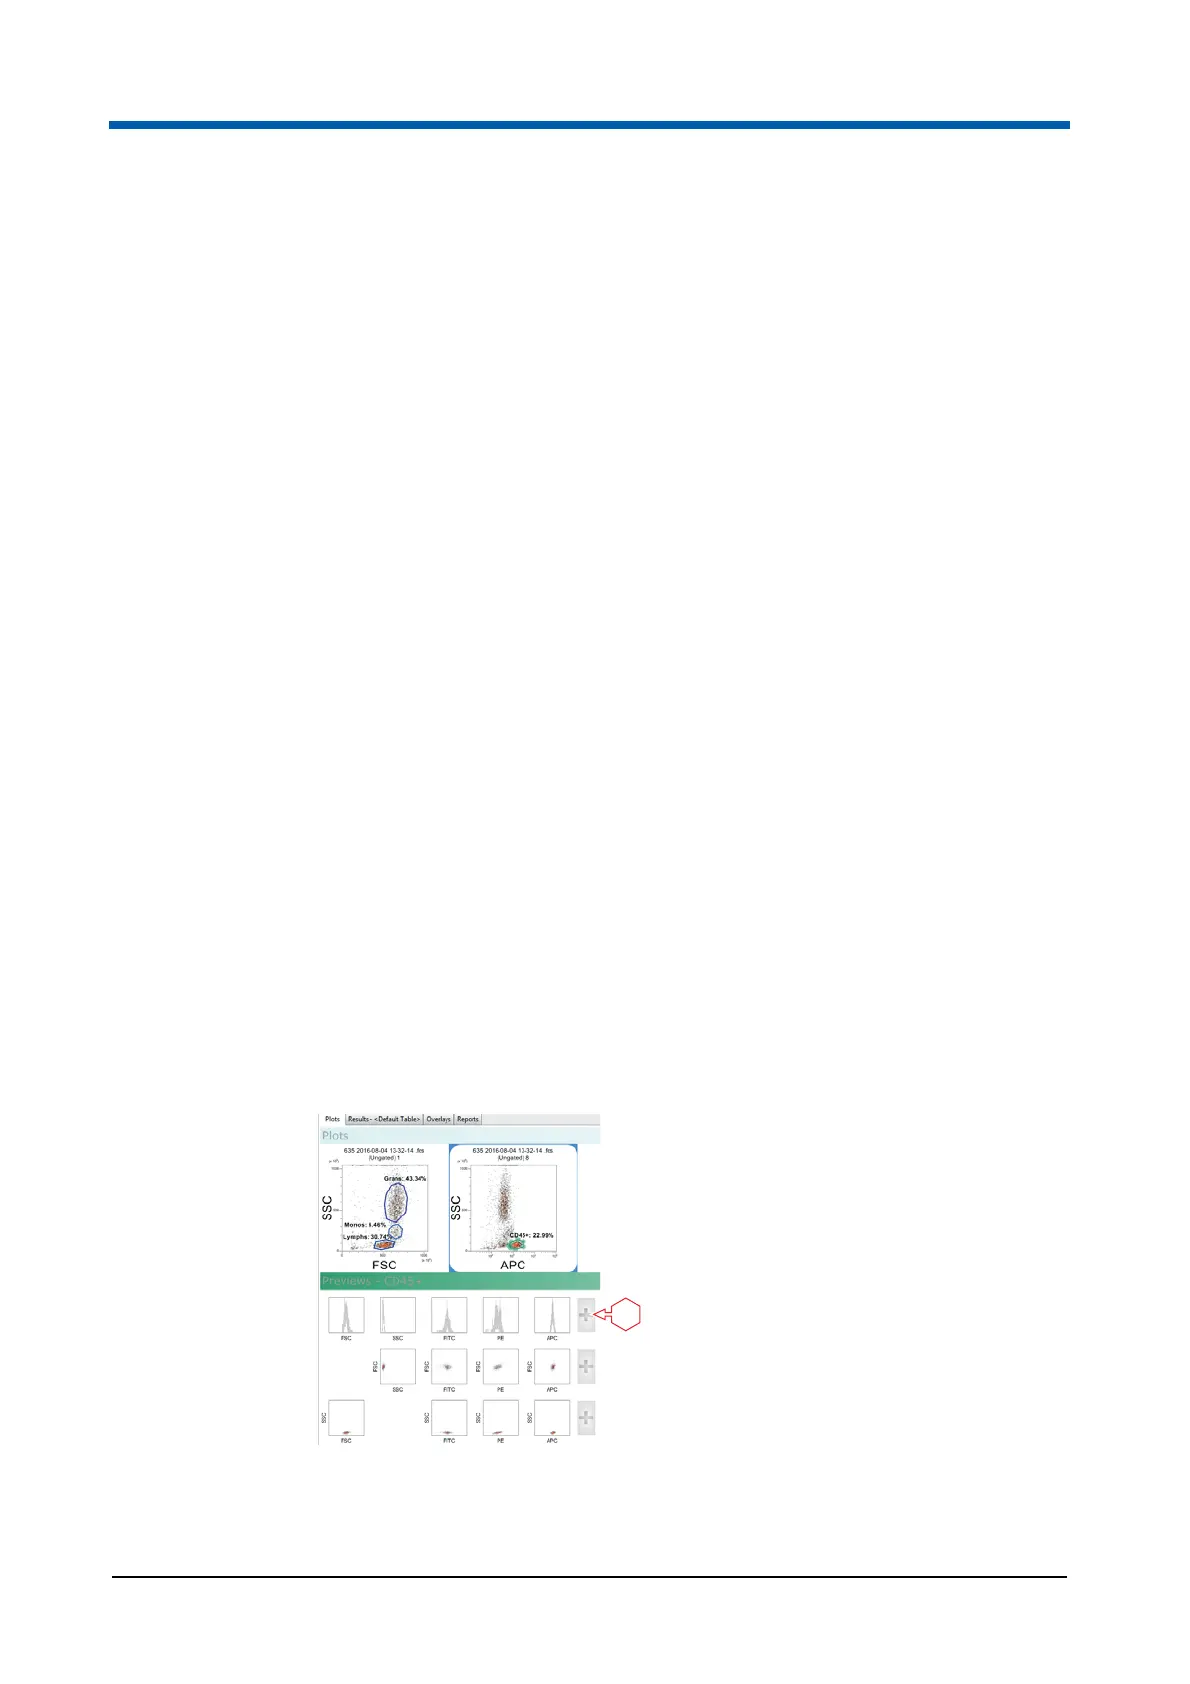
Adding plots to the Plots area
For adding plots to the Plots area, you can select plots from the Previews
area or use buttons of the Ribbon.
1 + button
1