12 Software description
CyFlow
®
Cube 8 | Operating Manual | May 2018 | Revision 032 75
switches between hiding and showing the previews. The setting of this
button will be persisted between sessions.
Previews Topmost: By default, the Plots area is positioned above the
Previews area in the Workspace. Clicking the button switches between
displaying the Previews area above and below the Plots area.
Quadrants on Previews: Clicking the button switches between
displaying and hiding a quadrant region on all of the dual parameter
preview plots. Only one quadrant can be displayed on each plot.
Unfiltered: Click the button to show preview plots for all currently
selected parameters. The Previews area is unfiltered by default.
FL only: Click the button to only show preview plots of fluorescence
parameters. Scatter and other parameters will not be displayed. Click the
Unfiltered button to re-show all preview plots.
Gate Filter: When this filter is applied, any preview plots containing
parameters that are being used as a part of the gate equation for the
selected plot or region are excluded from the preview. This can be used
to reduce the number of preview plots. Click the Unfiltered button to
re-show all preview plots.
Show Lower Triangle: Click the button to show or hide the plots
displayed on the lower left triangle of the Previews area.
Show Upper Triangle: Click the button to show or hide the plots
displayed on the upper right triangle of the Previews area.
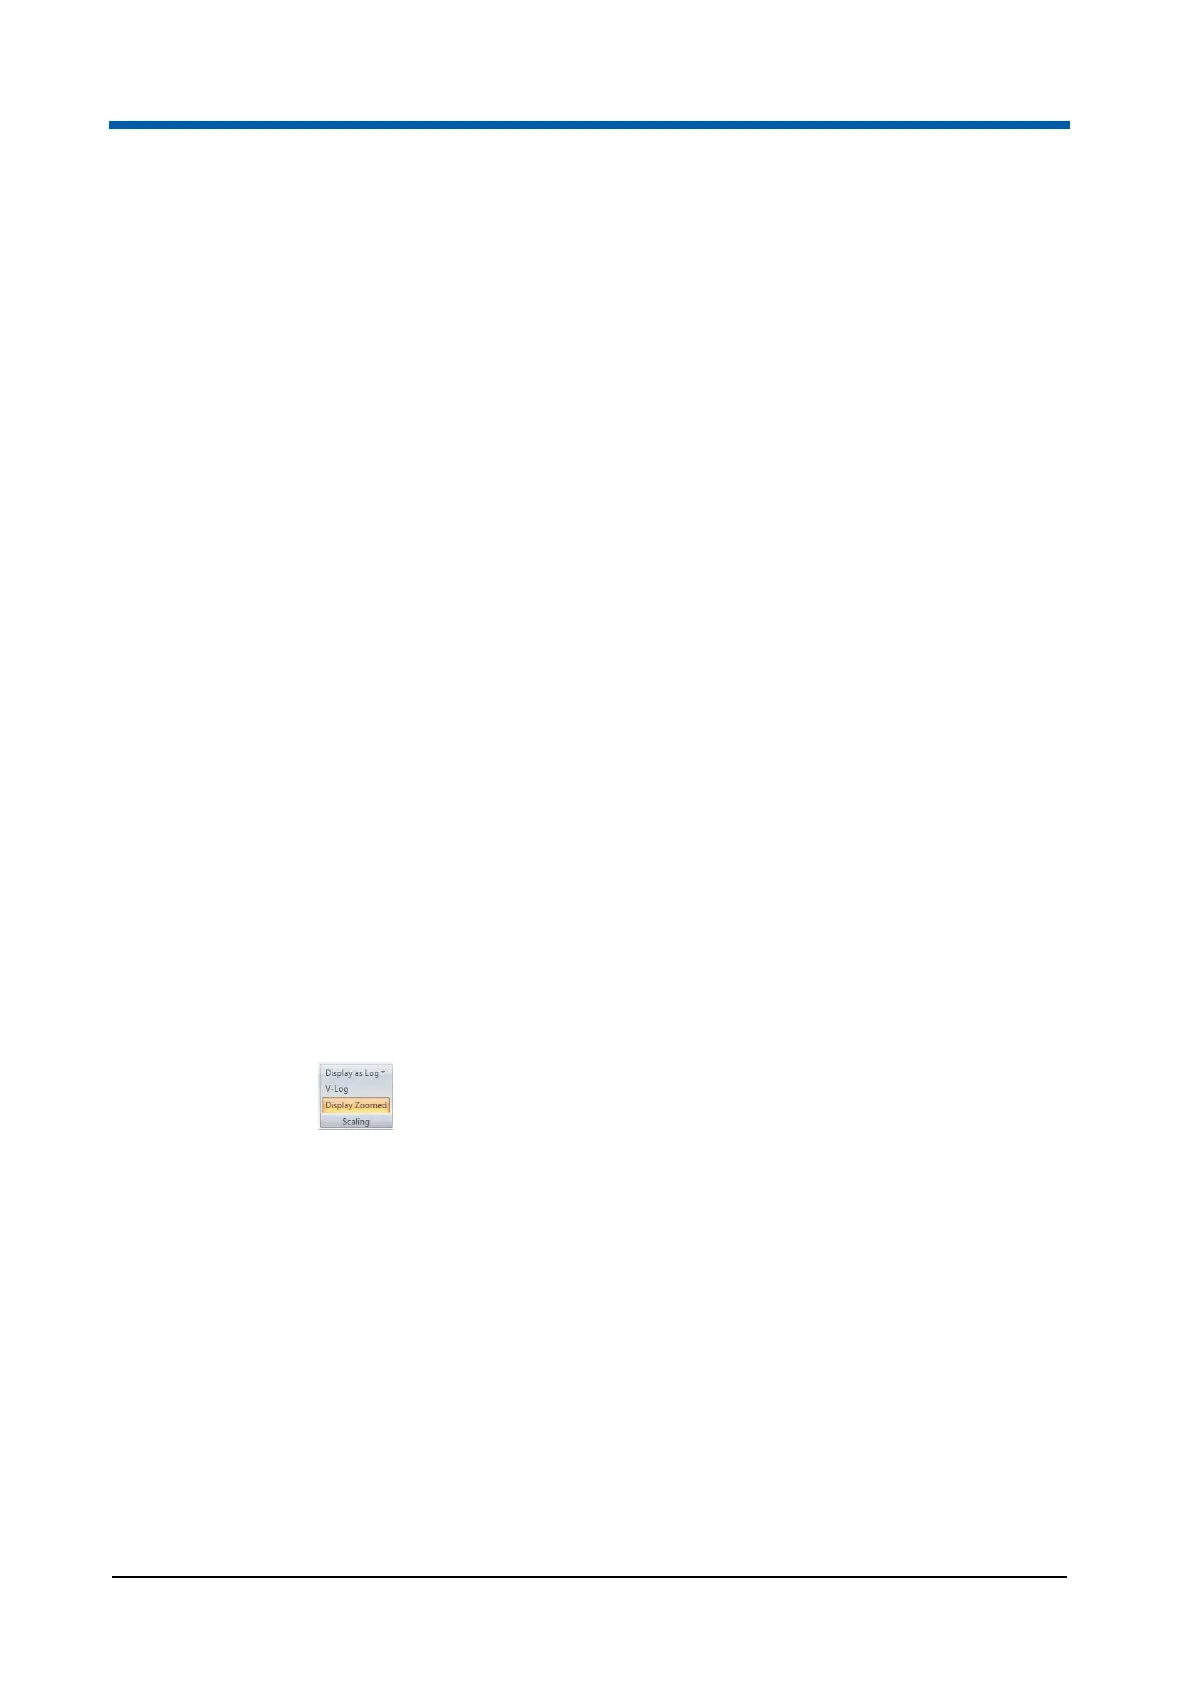
Scaling group
The Scaling group contains options to specify the scaling for parameters in
the Previews area. When no LMD file is open, or if a low-resolution file is
open, the controls in the Scaling group are disabled.
The Scaling group contains the following options:
Display as Log: The parameters displayed in the Previews area can be
shown with either linear or logarithmic scaling. Click the arrow to expand
a drop-down list and select the parameters to be displayed as
logarithmic.
V-Log: V-Log is an axis transformation that is similar to logarithmic for
the upper three decades, but has a linear section around the axis and
allows compensated events that have a "negative" fluorescence value to
be better visualised. Click the button to change all the logarithmic
parameters of the preview plots to V-Log scaling.
The V-Log scaling properties can be changed from the Scales group on
the Parameters tab of the Ribbon (see chapter Scales group on
page 80).