12 Software description
94 CyFlow
®
Cube 8 | Operating Manual | May 2018 | Revision 032
Region displays the name of the region or the DNA plot name.
Filename displays the LMD file name.
File Path displays the LMD full path and file name.
Plot Title displays the title of the plot.
FCS Key 1 and FCS Key 2 displays the respective FCS keywords. The
items are disabled in Worklist mode.
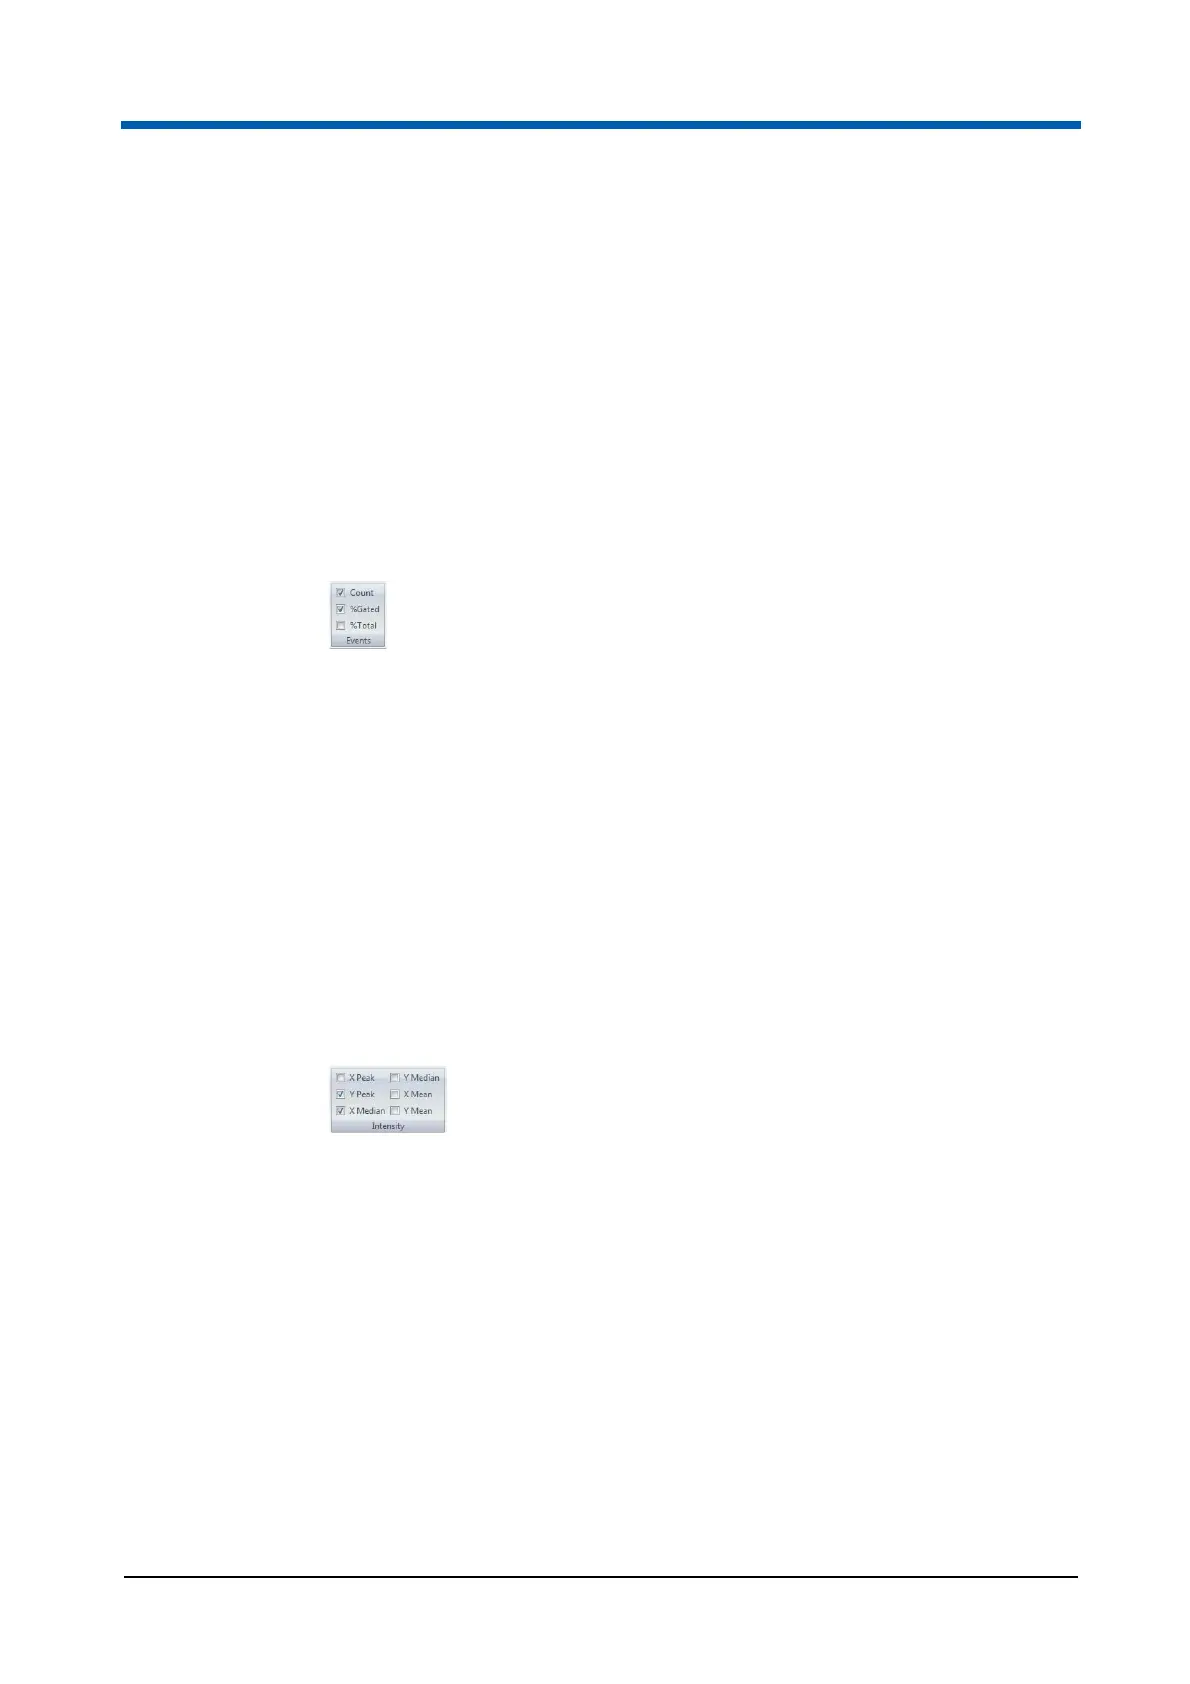
Events group
The items selected in this group are displayed on Plots, in the results table
and in selected Stats Boxes on the reports.
The following items can be selected:
Count displays the number of events in the region.
% Gated displays the percentage of events in the region compared to all
the events in the parent gate. Results will not be truncated, so any
statistic that is too large to appear on a plot will be hidden. You can
display just the region name by ensuring all check boxes are deselected.
% Total displays the percentage of events in the region compared to all
the events in the file.
Intensity group
The items selected in this group are displayed on Plots, in the results table
and in selected Stats Boxes on the reports. The Intensity group displays
statistical options that express the intensity of the generated populations.
The following items can be selected:
X Peak displays the peak channel (mode) for the X-axis histogram of a
region.
Y Peak displays the peak channel (mode) for the Y-axis histogram of a
region. Where the region is only a single parameter region, the entry on
the results table is left blank.
X Median displays the median average for the X-axis histogram of a
region.
Y Median displays the median average for the Y-axis histogram of a
region. Where the region is only a single parameter region, the entry on
the results table is left blank.
 Loading...