12 Software description
CyFlow
®
Cube 8 | Operating Manual | May 2018 | Revision 032 95
X Mean displays the mean average for the X-axis histogram of a region.
Y Mean displays the mean average for the Y-axis histogram of a region.
Where the region is only a single parameter region, the entry on the
results table is left blank.
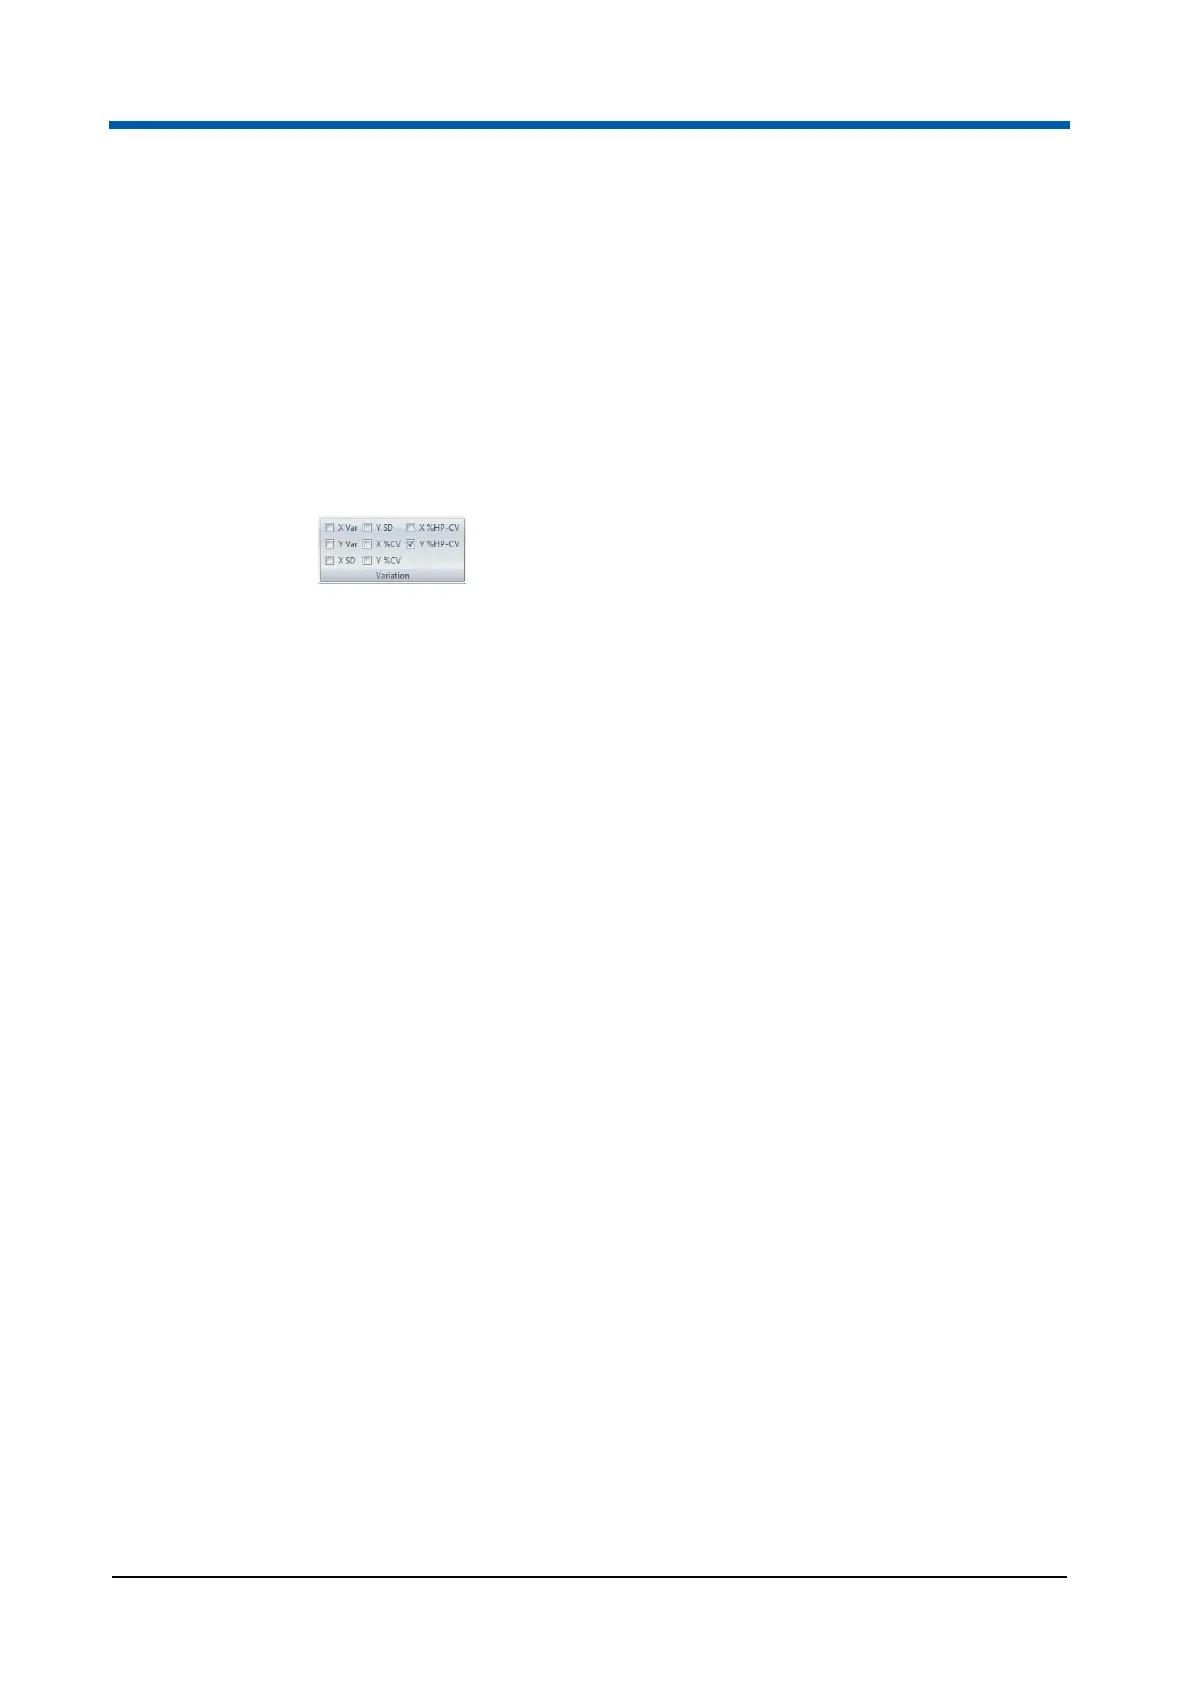
Variation group
The items selected in this group are displayed on Plots, in the results table
and in selected Stats Boxes on the reports. The Variation group displays
options that express the variation of populations.
The following items can be selected:
X Var displays the variance for the X-axis histogram of a region.
Y Var displays the variance for the Y-axis histogram of a region. Where
the region is only a single parameter region the entry on the results table
is left blank.
X SD displays the standard deviation for the X-axis histogram of a region.
Y SD displays the standard deviation for the Y-axis histogram of a region.
Where the region is only a single parameter region the entry on the
results table is left blank.
X %CV displays the Coefficient of Variation for the X scale range of
events. This allows comparison of the variation of populations that have
significantly different mean values. The X %CV is calculated by dividing
the standard deviation by the arithmetic mean and is displayed as a
percentage.
Y %CV displays the Coefficient of Variation for the Y scale range of
events. This allows comparison of the variation of populations that have
significantly different mean values. The Y %CV is calculated by dividing
the standard deviation by the arithmetic mean and is displayed as a
percentage.
X %HP-CV displays the Half-Peak Coefficient of Variation for the X scale
range of events. The X %HP-CV uses a standard deviation calculated
from the scale width between the half peak points either side of the Peak.
Once the standard deviation is calculated, it is divided by the arithmetic
mean and displayed as a percentage.
Y %HP-CV displays the Half-Peak Coefficient of Variation for the Y scale
range of events. The Y %HP-CV uses a standard deviation calculated
from the scale width between the half peak points either side of the Peak.
Once the standard deviation is calculated it is divided by the arithmetic
mean and displayed as a percentage.