12 Software description
96 CyFlow
®
Cube 8 | Operating Manual | May 2018 | Revision 032
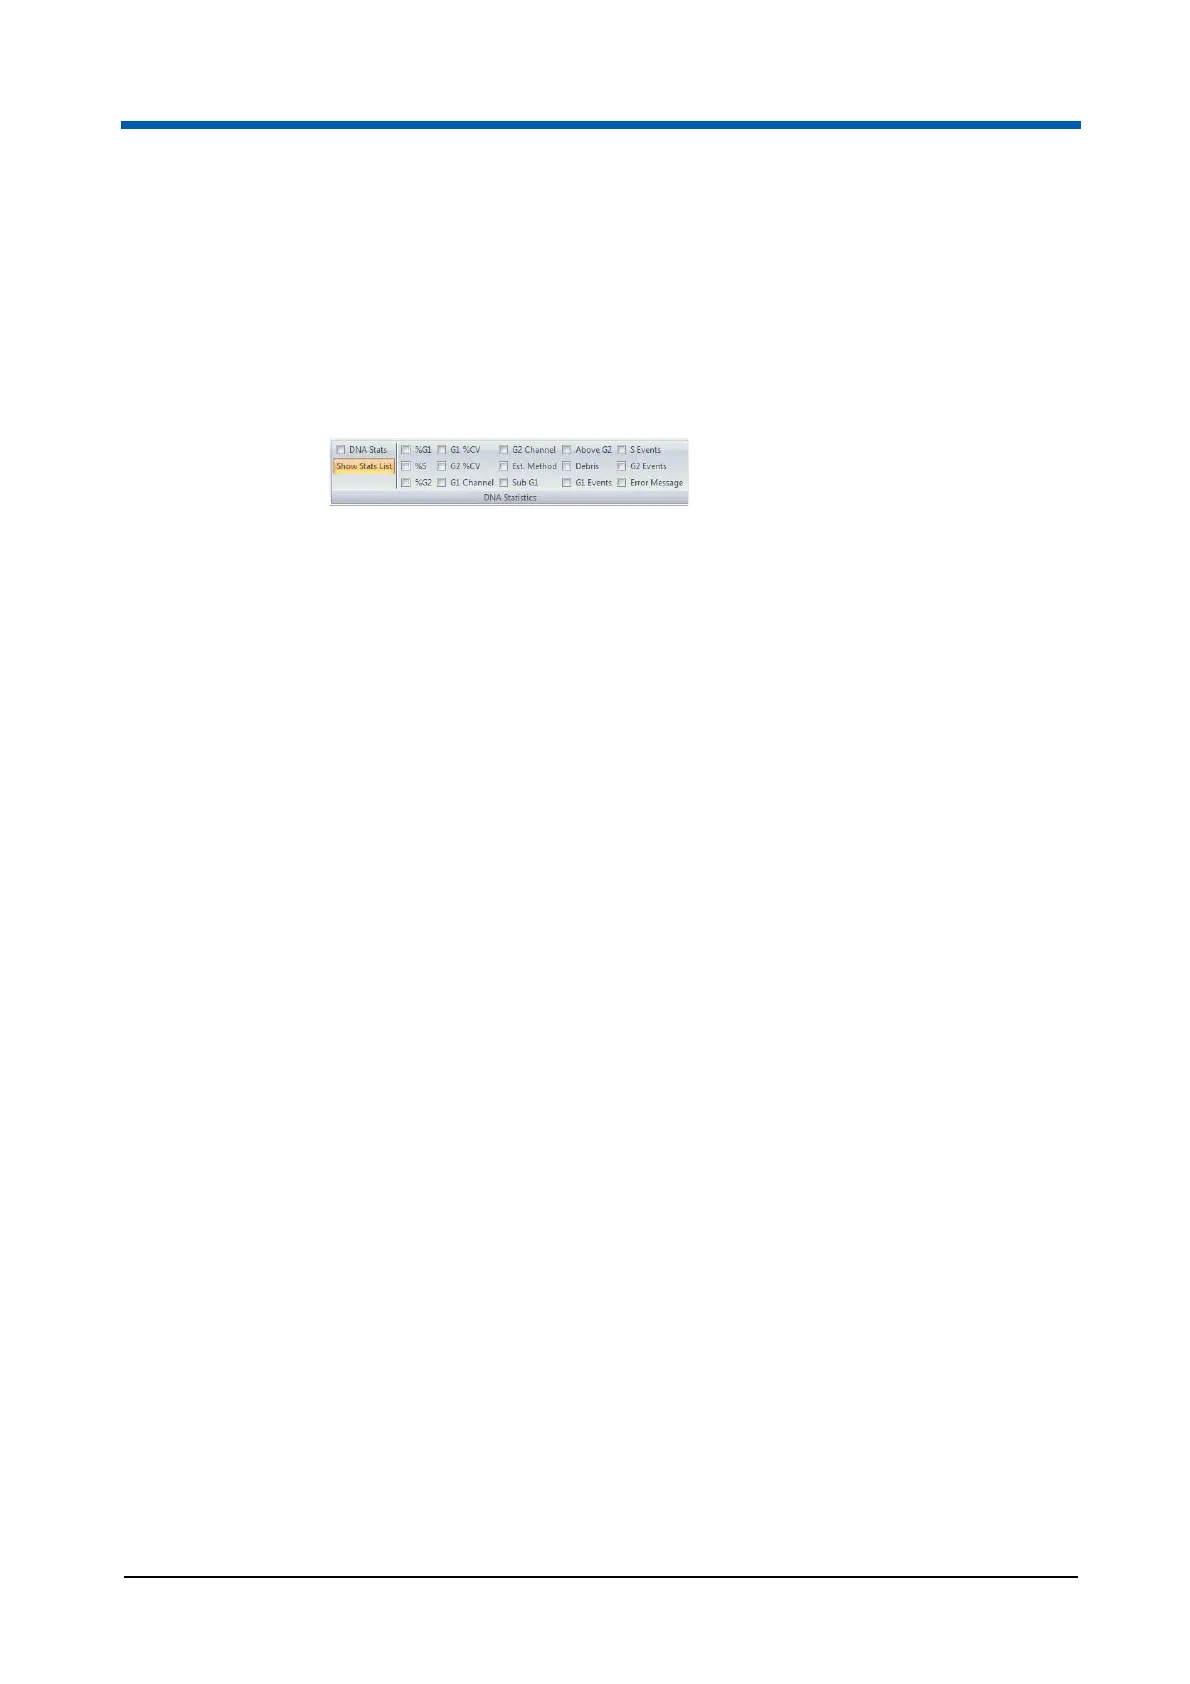
DNA Statistics group
The DNA Statistics group displays the statistical options associated with the
DNA cell cycle plots.
The items selected in this group are displayed in the results table and in
selected Stats Boxes on the reports. When a cell cycle plot is present in the
Plots area, the statistics in the DNA Statistics group are selected by default.
The following items can be selected:
DNA Stats: Select the check box to display all DNA statistics for all
regions in the results table.
Show Stats List: Click the button and open the "DNA Statistics"
drop-down list to access the individual DNA statistic settings:
%G1 displays events in the G1 phase, represented as a percentage of
the total of events in G1, G2 and S phase.
%S displays events in the S phase, represented as a percentage of the
total of events in G1, G2 and S phase.
%G2 displays events in the G2 phase, represented as a percentage of
the total of events in G1, G2 and S phase.
G1 %CV displays the Coefficient of Variation for the G1 phase. This is
calculated by dividing the G1 phase standard deviation by the arithmetic
mean and is displayed as a percentage.
G2 %CV displays the Coefficient of Variation for the G2 phase. This is
calculated by dividing the G2 phase standard deviation by the arithmetic
mean and is displayed as a percentage.
G1 Channel displays the position of the G1 calculated peak channel.
G2 Channel displays the position of the G2 calculated peak channel.
Est. Method displays the estimate method used. This can be Automatic
or User.
Sub G1 displays the number of events above the lower threshold divider
and below the G1 phase.
Above G2 displays the number of events below the upper threshold
divider and above the G2 phase.
Debris displays the number of DNA debris events. These are the events
outside the threshold limits.
G1 Events displays the number of events in the G1 phase.
S Events displays the number of events in the S phase.
G2 Events displays the number of events in the G2 phase.