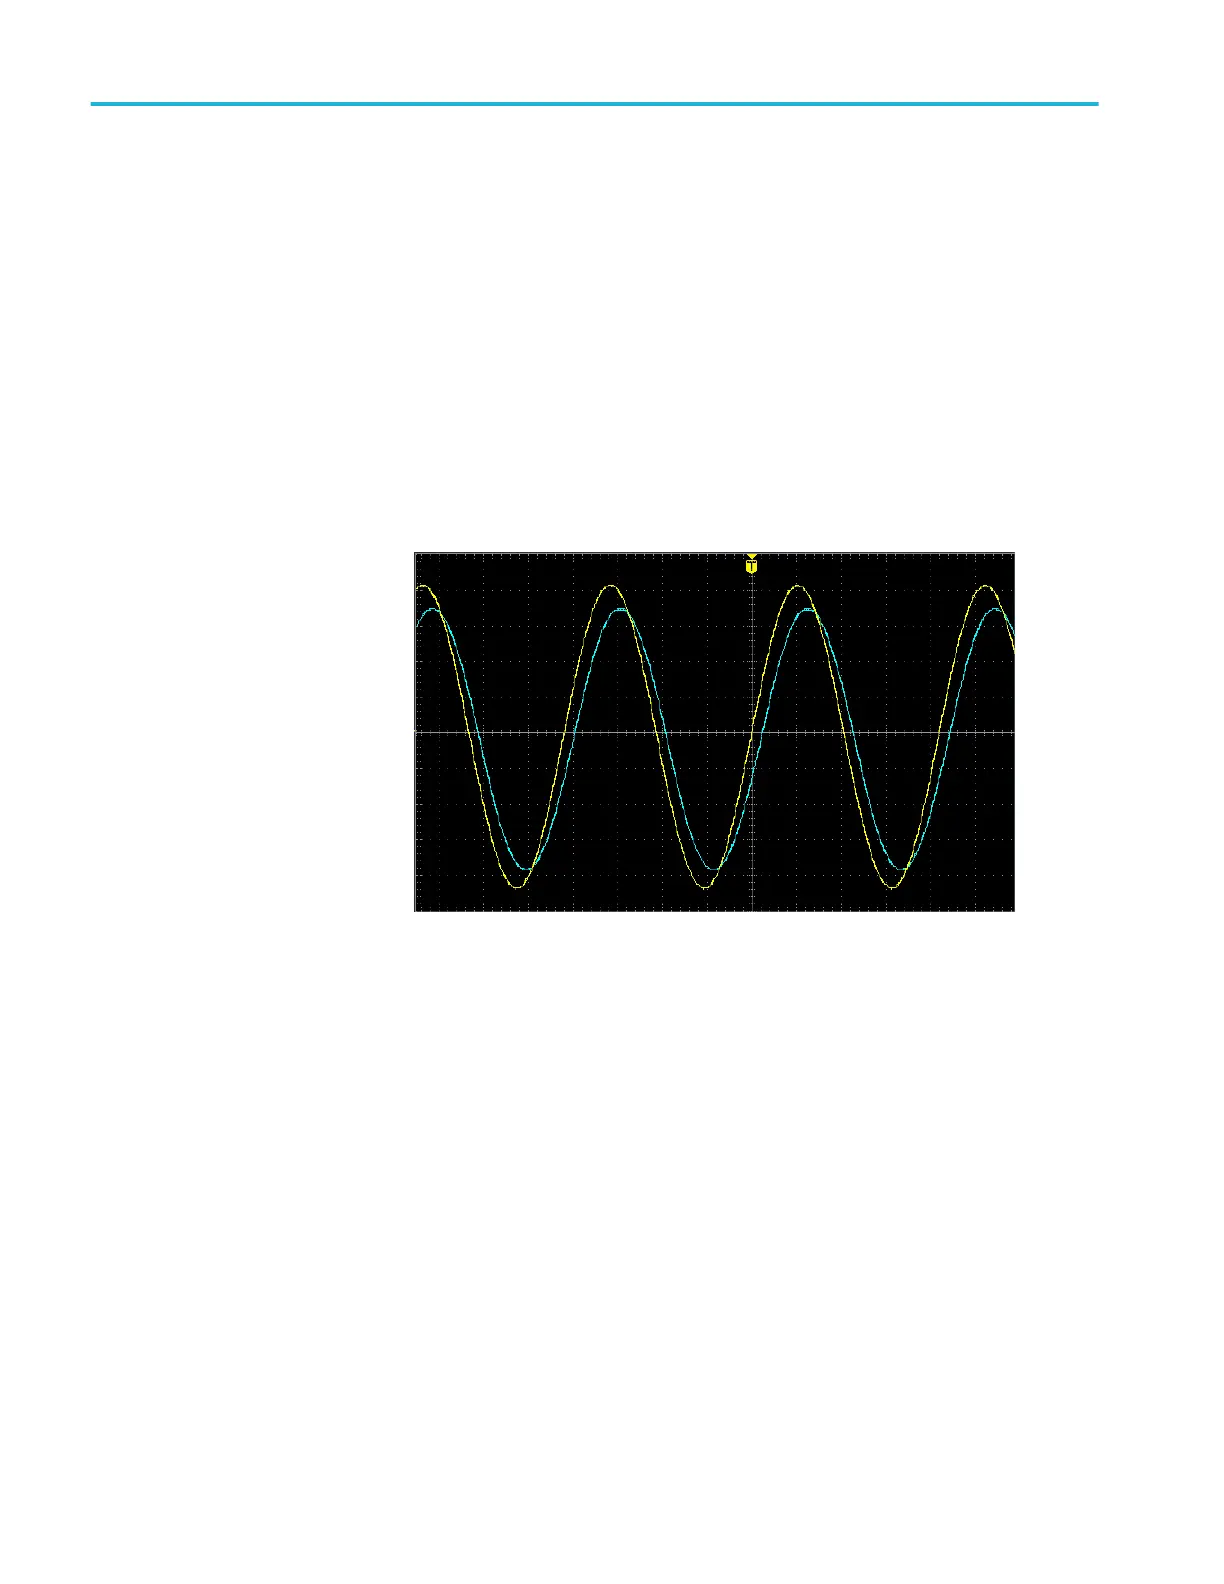
The XY display mode
The XY display mode plots the signal amplitude of channel 1 (X) against the
amplitude of channel 2 (Y), where channel 1 is the horizontal axis and channel
2 is the vertical axis. XY display mode is useful for showing signal phase or
frequency relationships between periodic signals. The resulting XY plots are
called Lissajou patterns.
You can display Ch 1 versus Ch 2 on two-channel models.
1. Select the two signal sources that you want to plot. Push the Vertical
Position knob for each channel to set the ground reference of both signals to
0 V (center horizontal graticule) so that the XY plot is centered on the screen.
Waveform display settings
82 TBS1000C Series Oscilloscopes User Manual
 Loading...