Previews 121
12. Display the Plot Setup screen.
Plot 1 is highlighted by default.
… lets you clear highlighted Plot settings.
Press „
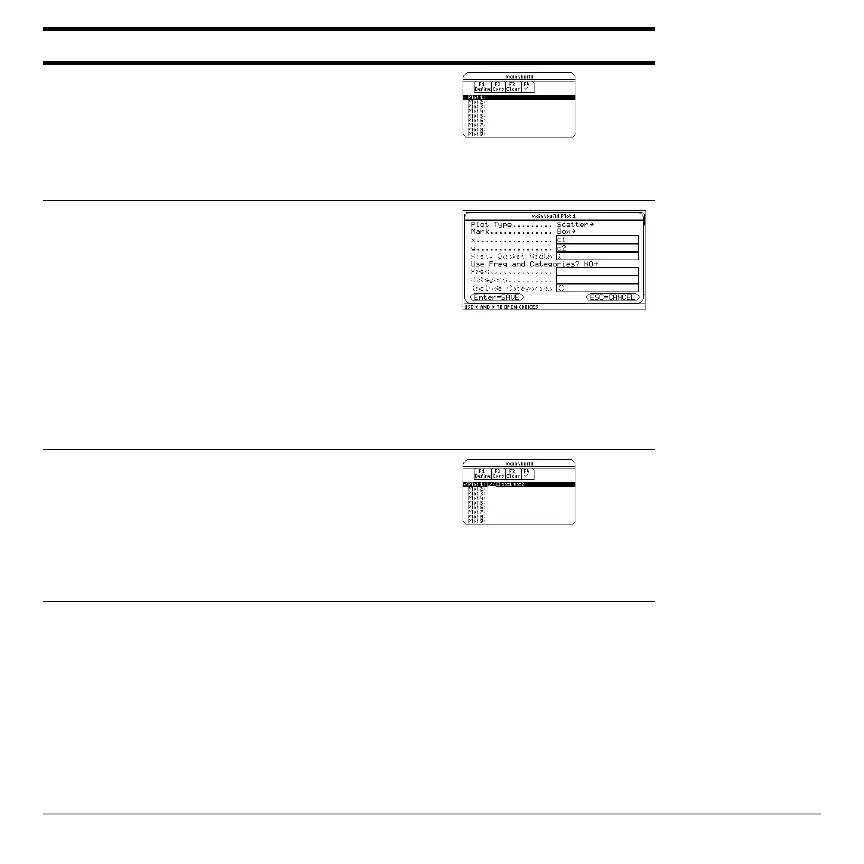
13. Define
Plot 1 as:
Plot Type = Scatter
Mark = Box
x = C1
y = C2
Notice the similarities between this and
the
Calculate dialog box.
Press , B 1 D B 1 D C1 D C2
14. Save the plot definition and return to the
Plot Setup screen.
Notice the shorthand notation for
Plot 1’s
definition.
Press ¸ twice
Steps and keystrokes Display

 Loading...


