Previews 125
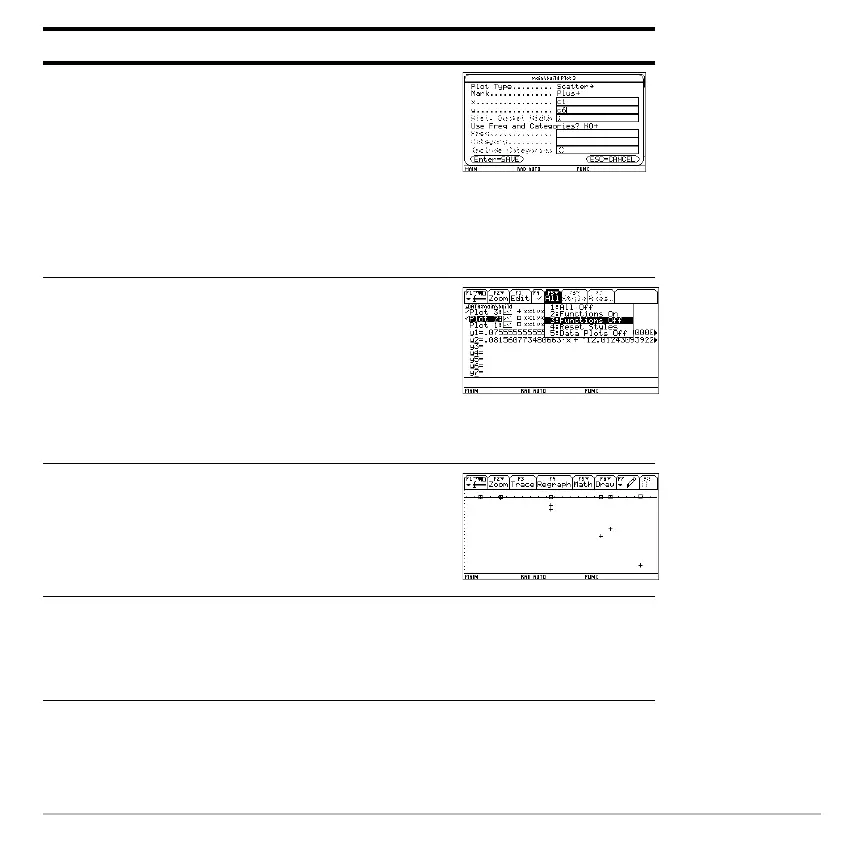
25. Highlight Plot 3 and define it as:
Plot Type = Scatter
Mark = Plus
x = C1
y = C6
(LinReg residuals)
Press D , D B 3 D C1 D C6 ¸
¸
26. Display the
Y= Editor and turn all the y(x)
functions off.
From ‡, select
3:Functions Off, not
1:All Off.
Plots 2 and 3 are still selected.
Press 8 # ‡ 3
27. Use
ZoomData to graph the residuals.
› marks the MedMed residuals;
+ marks the LinReg residuals.
Press „ 9
28. Display the Home screen.
Press 8 "
Steps and keystrokes Display

 Loading...


