Differential Equation Graphing 438
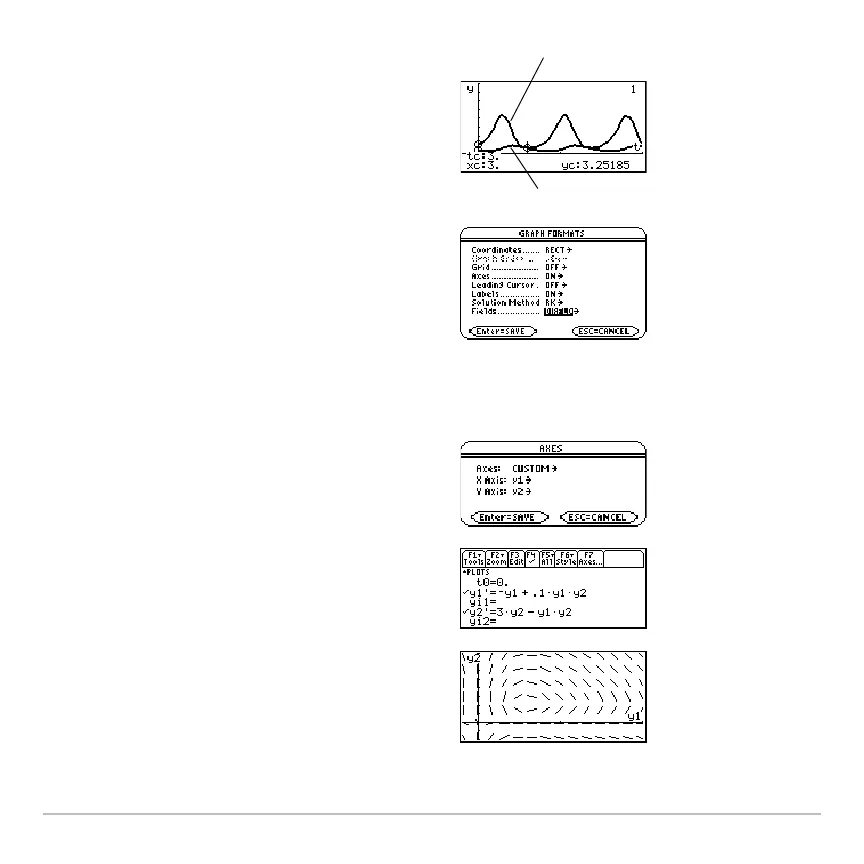
7. Press … to trace. Then press 3 ¸ to
see the number of foxes (
yc for y1) and
rabbits (
yc for y2) at t=3.
Note: Use C and D to move the trace
cursor between the curves for
y1 and y2.
8. Return to the Y= Editor. Press:
,
9
— or —
H8
F
Set Fields = DIRFLD.
Note: In this example, DIRFLD is used for
two related differential equations that do
not represent a 2nd-order equation.
9. Press:
H‰
Confirm that the axes are set as shown.
10. In the Y= Editor, clear the initial conditions
for
yi1 and yi2.
11. Return to the Graph screen, which
displays only the direction field.
y2(t)
y1(t)

 Loading...


