Statistics and Data Plots 551
4. Specify applicable settings for the active items.
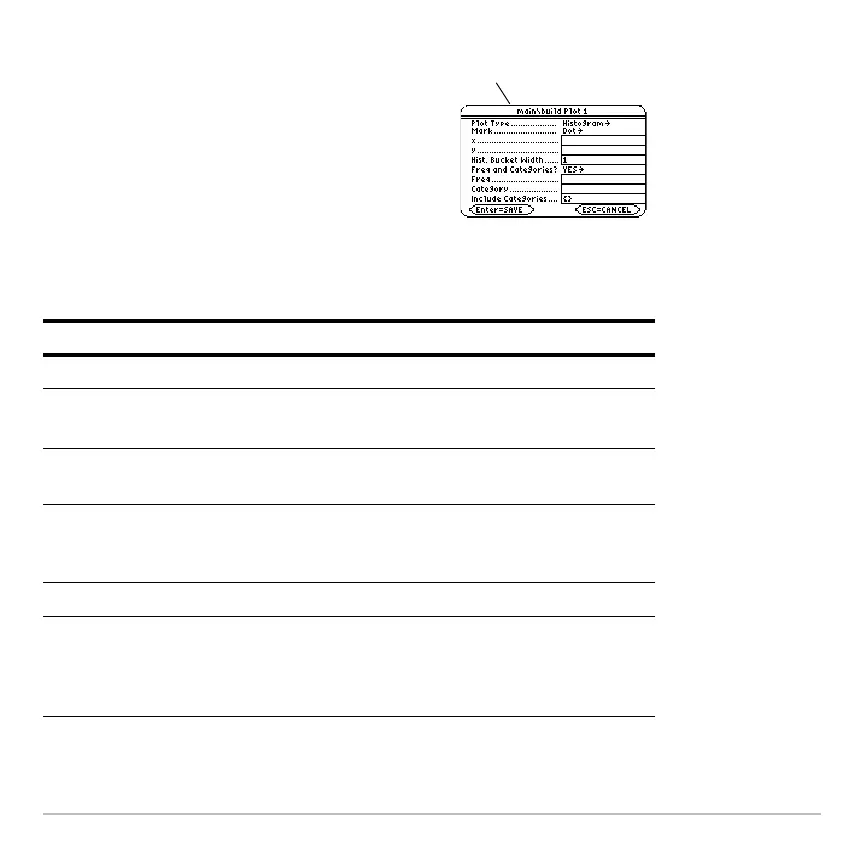
3. Press ,
to define the plot.
This example shows all items as active.
On your calculator, items are active only if
they are valid for the current setting of
Plot Type and use Freq and Categories?.
Note: If an item is not valid for the current
settings, it will appear dimmed. You
cannot move the cursor to a dimmed item.
Item Description
Plot Type Select the type of plot.
Mark
Select the symbol used to plot the data points: Box (
›),
Cross (x), Plus (+), Square (
0), or Dot (¦).
x Type the column number in the Data/Matrix Editor (C1,
C2, etc.) used for x values, the independent variable.
y Type the column number used for y values, the
dependent variable. This is active only for Plot Type =
Scatter or xyline.
Hist. Bucket Width Specifies the width of each bar in a histogram.
Freq and
Categories?
Select NO or YES. Note that Freq, Category, and
Include Categories are active only when Freq and
Categories? = YES. (Freq is active only for Plot Type =
Box Plot or Histogram.)
Pathname of the data
variable

 Loading...


