Previews 91
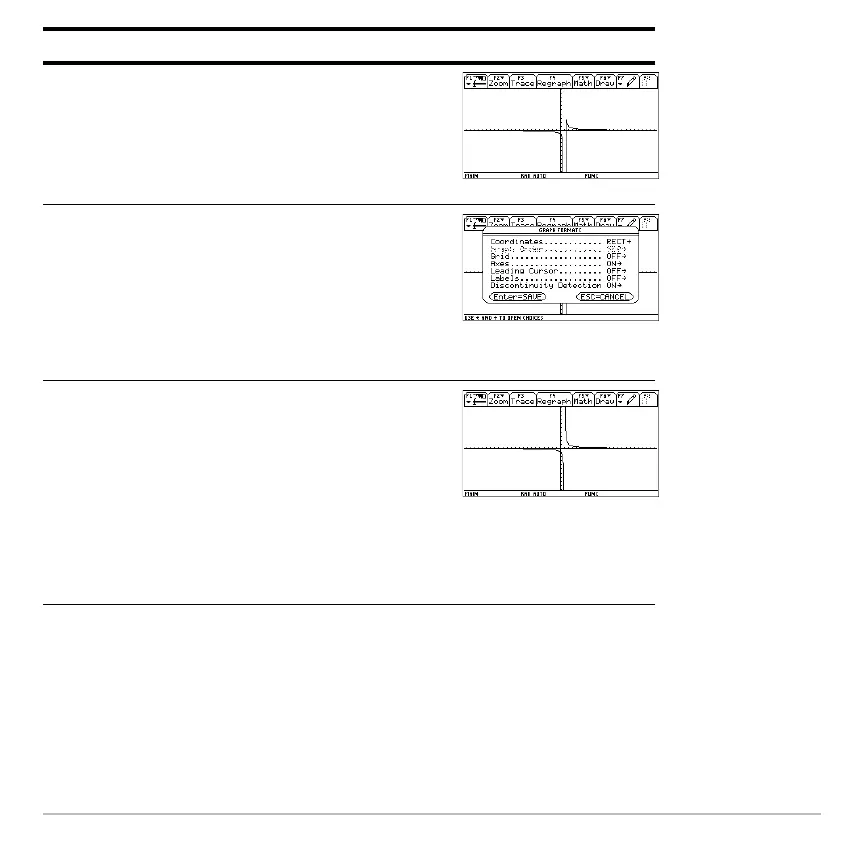
4. Execute the Graph command, which
automatically displays the Graph screen.
Observe the “faux” asymptotes contained
in the graph.
Press 8 %q
5. Display the Graph Formats dialog box
and set “Detect Discontinuities” to ON.
Note: The second item on the Graph
Format dialog is greyed out, which means
the graph order is set to sequential “Seq”.
Press 8 FD D D D D D B 2 ¸
6. Execute the
Graph command, which
automatically displays the Graph screen.
No”faux” asymptotes are present on the
graph.
Note: Graphing speed may slow
considerably when “Detect
Discontinuities” is set to ON.
Press 8 %(q
Steps and keystrokes Display

 Loading...


