Image and analyze the chips
■
About imaging and primary analysis .................................... 40
■
About the instrument interface ......................................... 41
■
Chip imaging ........................................................ 42
■
Primary analysis ..................................................... 46
■
Using the QuantStudio
™
3D AnalysisSuite
™
Software .................... 51
About imaging and primary analysis
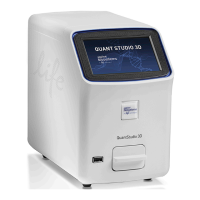
The QuantStudio
™
3D Digital PCR Instrument performs image capture and
subsequent preliminary analysis of chips following thermal cycling. The instrument
processes chips individually, where each read lasts approximately one minute. After
reading a chip, the instrument performs an initial evaluation of the imaging data
collected during the run and displays the results on the instrument touchscreen.
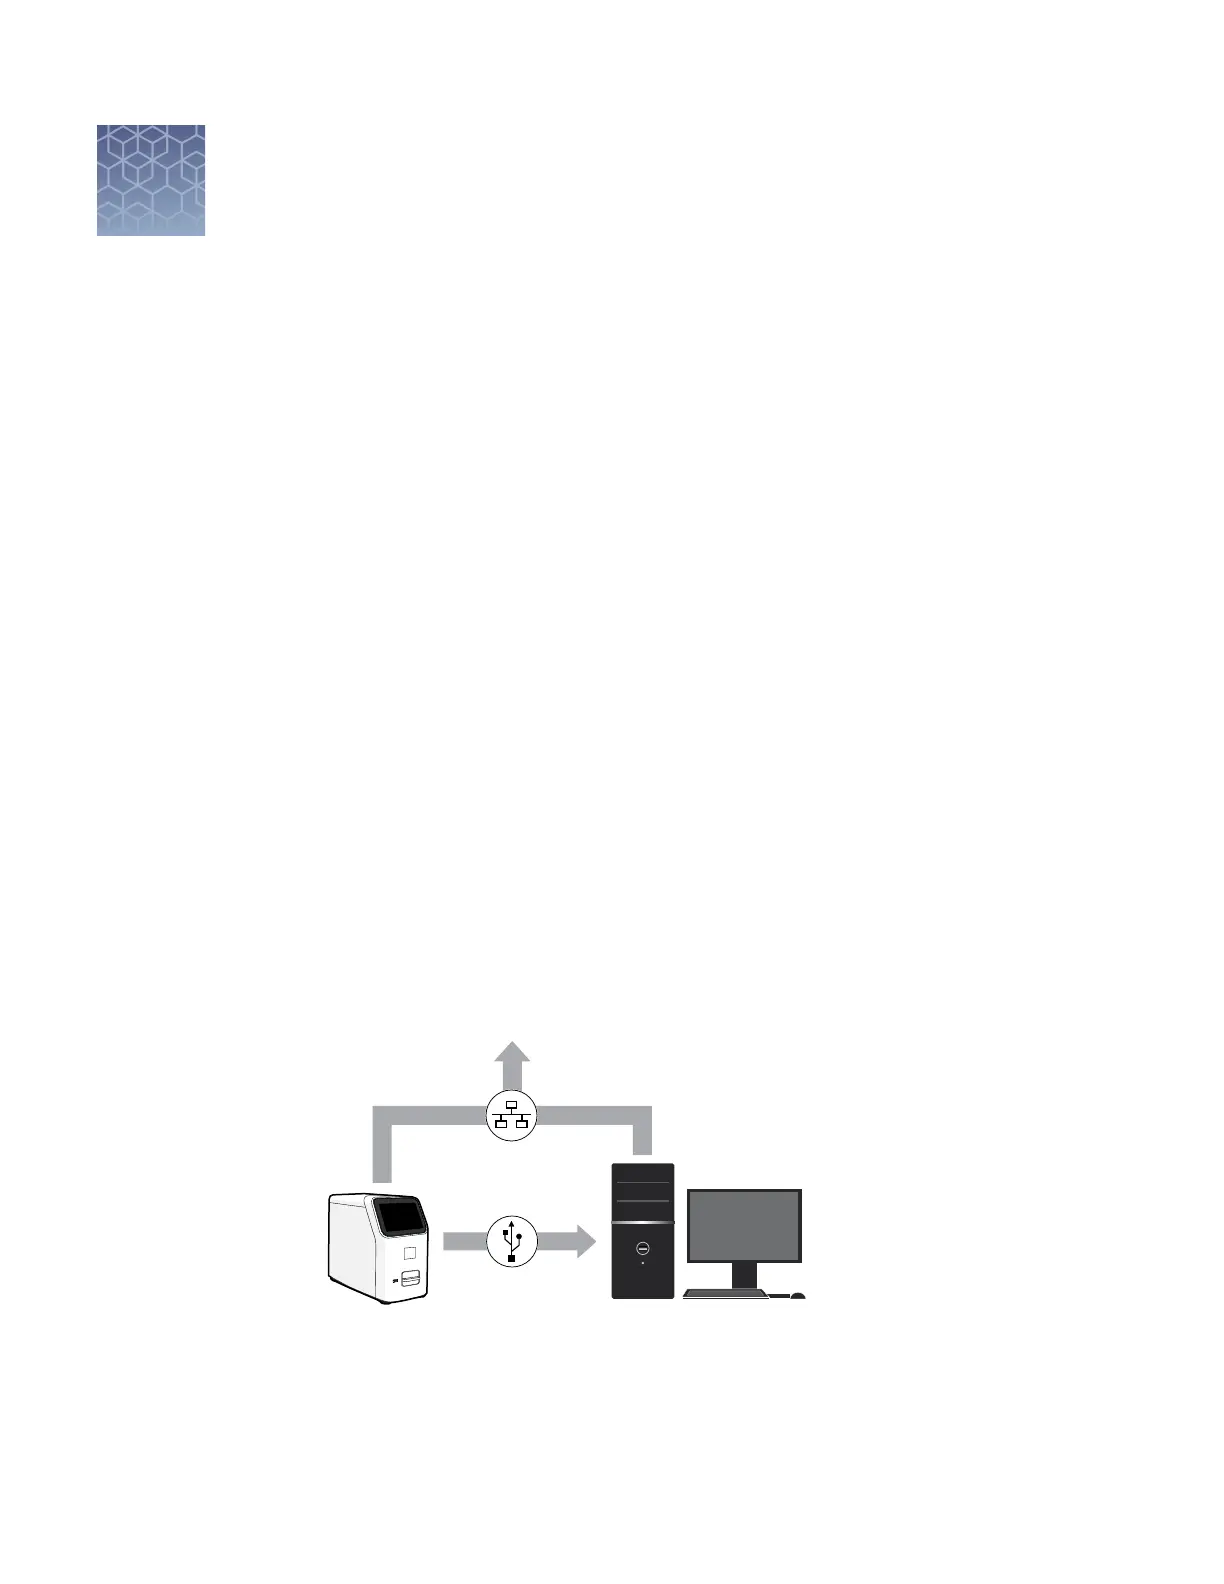
For each imaged chip, the QuantStudio
™
3D Instrument generates and saves a single
experiment (.eds) le that contains the processed imaging data and the results from
the preliminary analysis on the instrument. Depending on the chosen data
destination, the instrument transfers the saved imaging data directly to the Connect
cloud-based platform for immediate access by the AnalysisSuite
™
Software, or to a
network le server or local USB drive for later manual import.
QuantStudio™ 3D
AnalysisSuite™ Software
5
QuantStudio
™
3D System
data flow
40
QuantStudio
™
3D Digital PCR System User Guide