3-62 Using the Detector
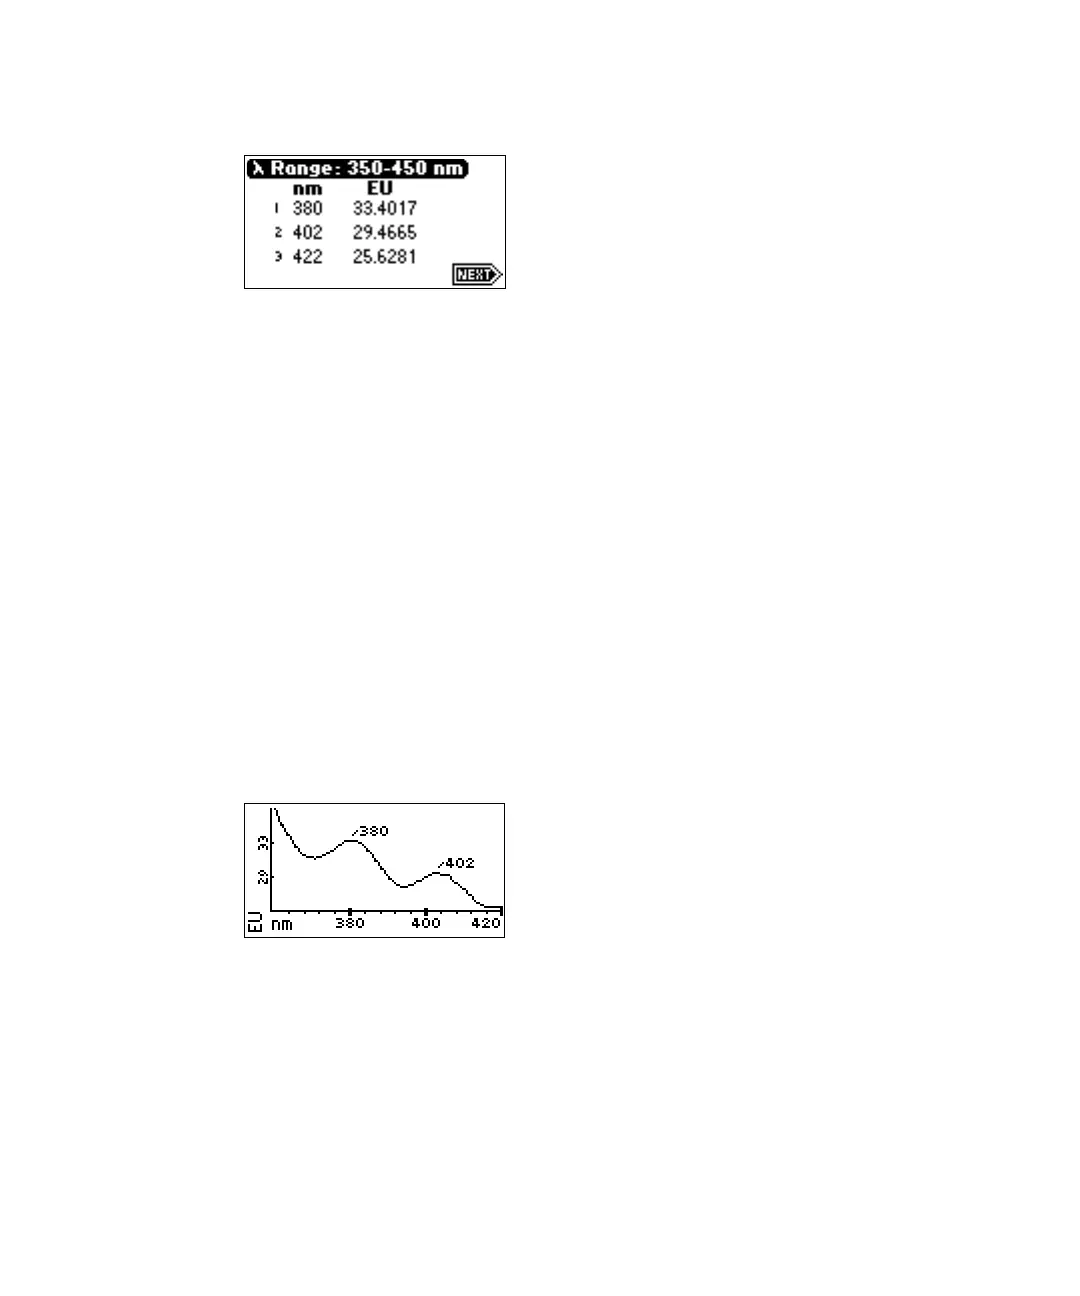
Highest peaks of sample anthracene scan
6. Press Next to return to the graph.
7. Select Scale (Shift, TRACE) to change the scale and zoom in on one
section (artifact) of the spectrum. The scale of the spectrum is affected
by the EUFS setting. You can alter the following four scaling
parameters:
• λ1 – Minimum wavelength displayed.
• λ2 – Maximum wavelength displayed.
• EU1 – Minimum fluorescence displayed. (The default is auto.)
• EU2 – Maximum fluorescence displayed. (The default is auto.)
8. Press Next to advance through the four scaling parameters. The
following figure shows the sample from the figure “Graph of sample
anthracene scan” on page 3-61 after scaling the wavelength parameters
to 225 and 420 nm.
Anthracene scan with λ2 changed to 420 nm
9. If you change one or more scaling parameters, press Enter to reformat
the graph.
10. Press Next to display the properties of the highest peaks of the scaled
scan.