3-24 Using the Detector
• T1 represents the left-hand side of the trace, or ending time (default
is -30).
• T2 represents the right-hand side of the trace, or starting time
(default is 0).
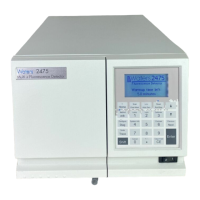
The following figure shows a 60-minute trace of continuous injections of
salicylic acid and naproxin with the excitation wavelength set to 240 nm and
emission to 355 nm.
Scaled trace of continuous injections with T1 changed to -60
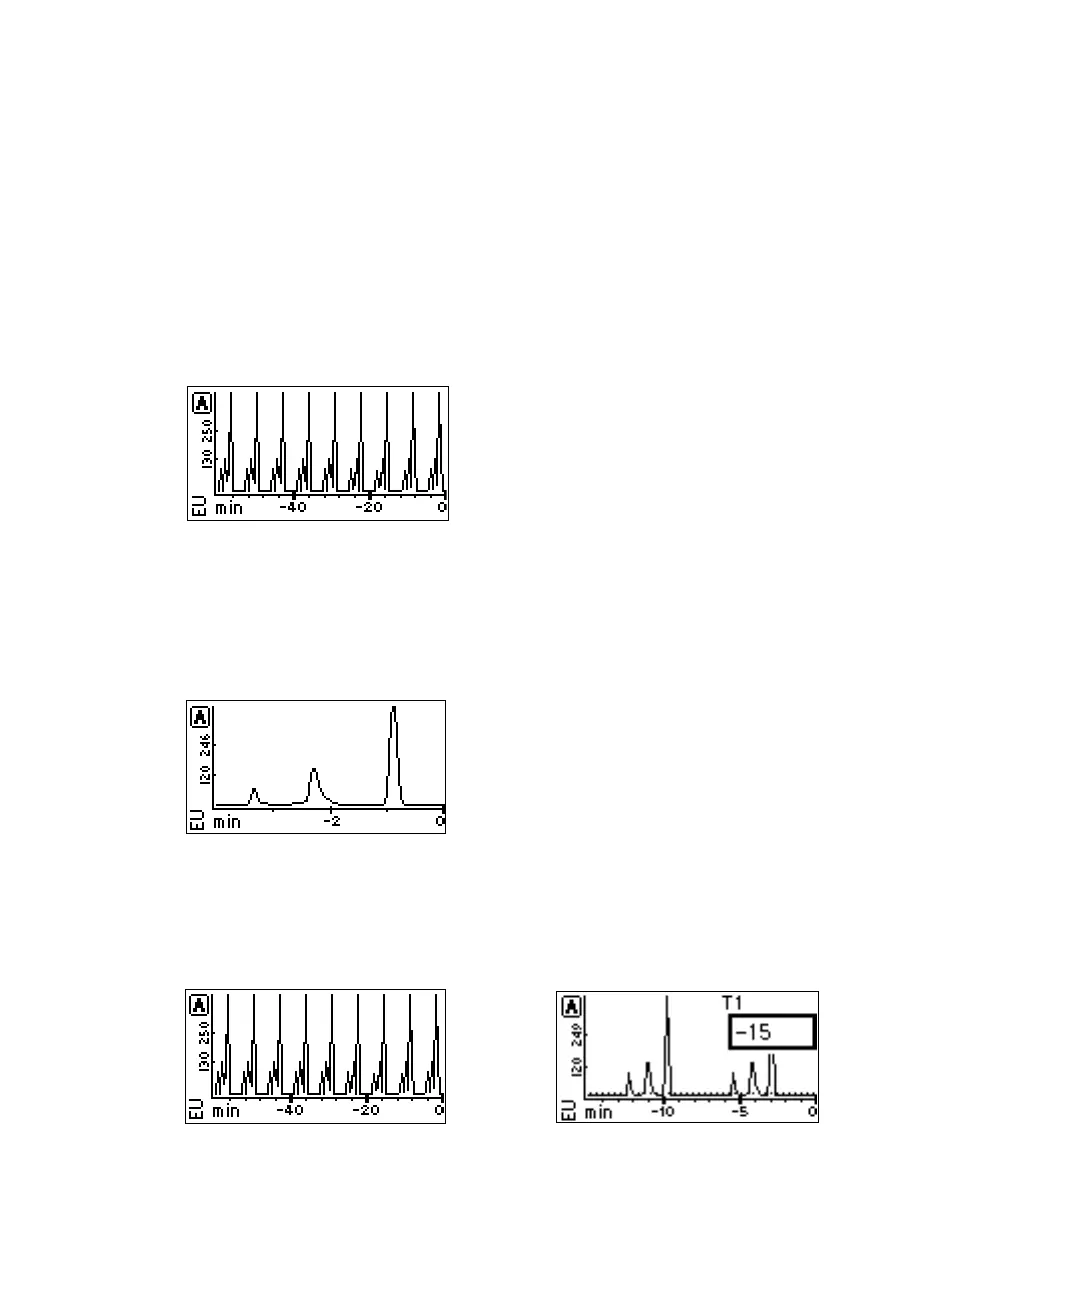
The following figure shows a 4-minute scaled trace (or zoom) of the 60 minutes
of continuous injections shown in the previous figure. T1 is changed to -4. T2
is changed to 0. EU1 and EU2 remain as auto.
Scaled trace for 4 minutes changing T1 to -4
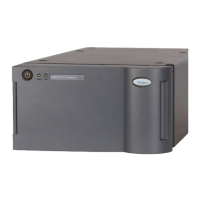
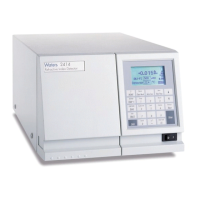
The following figure shows a 60-minute trace on channel A scaled to the last
15 minutes. T1 is changed to -15.
Scaled trace changing T1 to -15