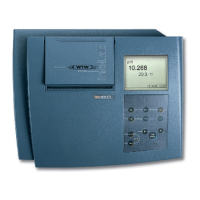
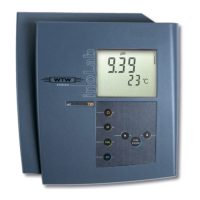
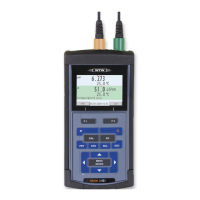
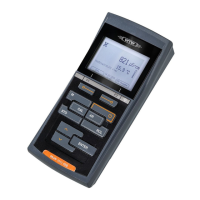
pH value inoLab
®
Multi 9620 IDS
36 ba77173e04 12/2017
5.2.6 Calibration data
Displaying the cali-
bration data
The calibration record of the last calibration is available in the menu Calibration
/ Calibration record. To open it in the measured value display, press the
<CAL_> key.
The calibration records of the last 10 calibrations are available in the menu Cali-
bration / Calibration data storage / Display. To open the Calibration menu in the
measured value display, press the <ENTER> key.
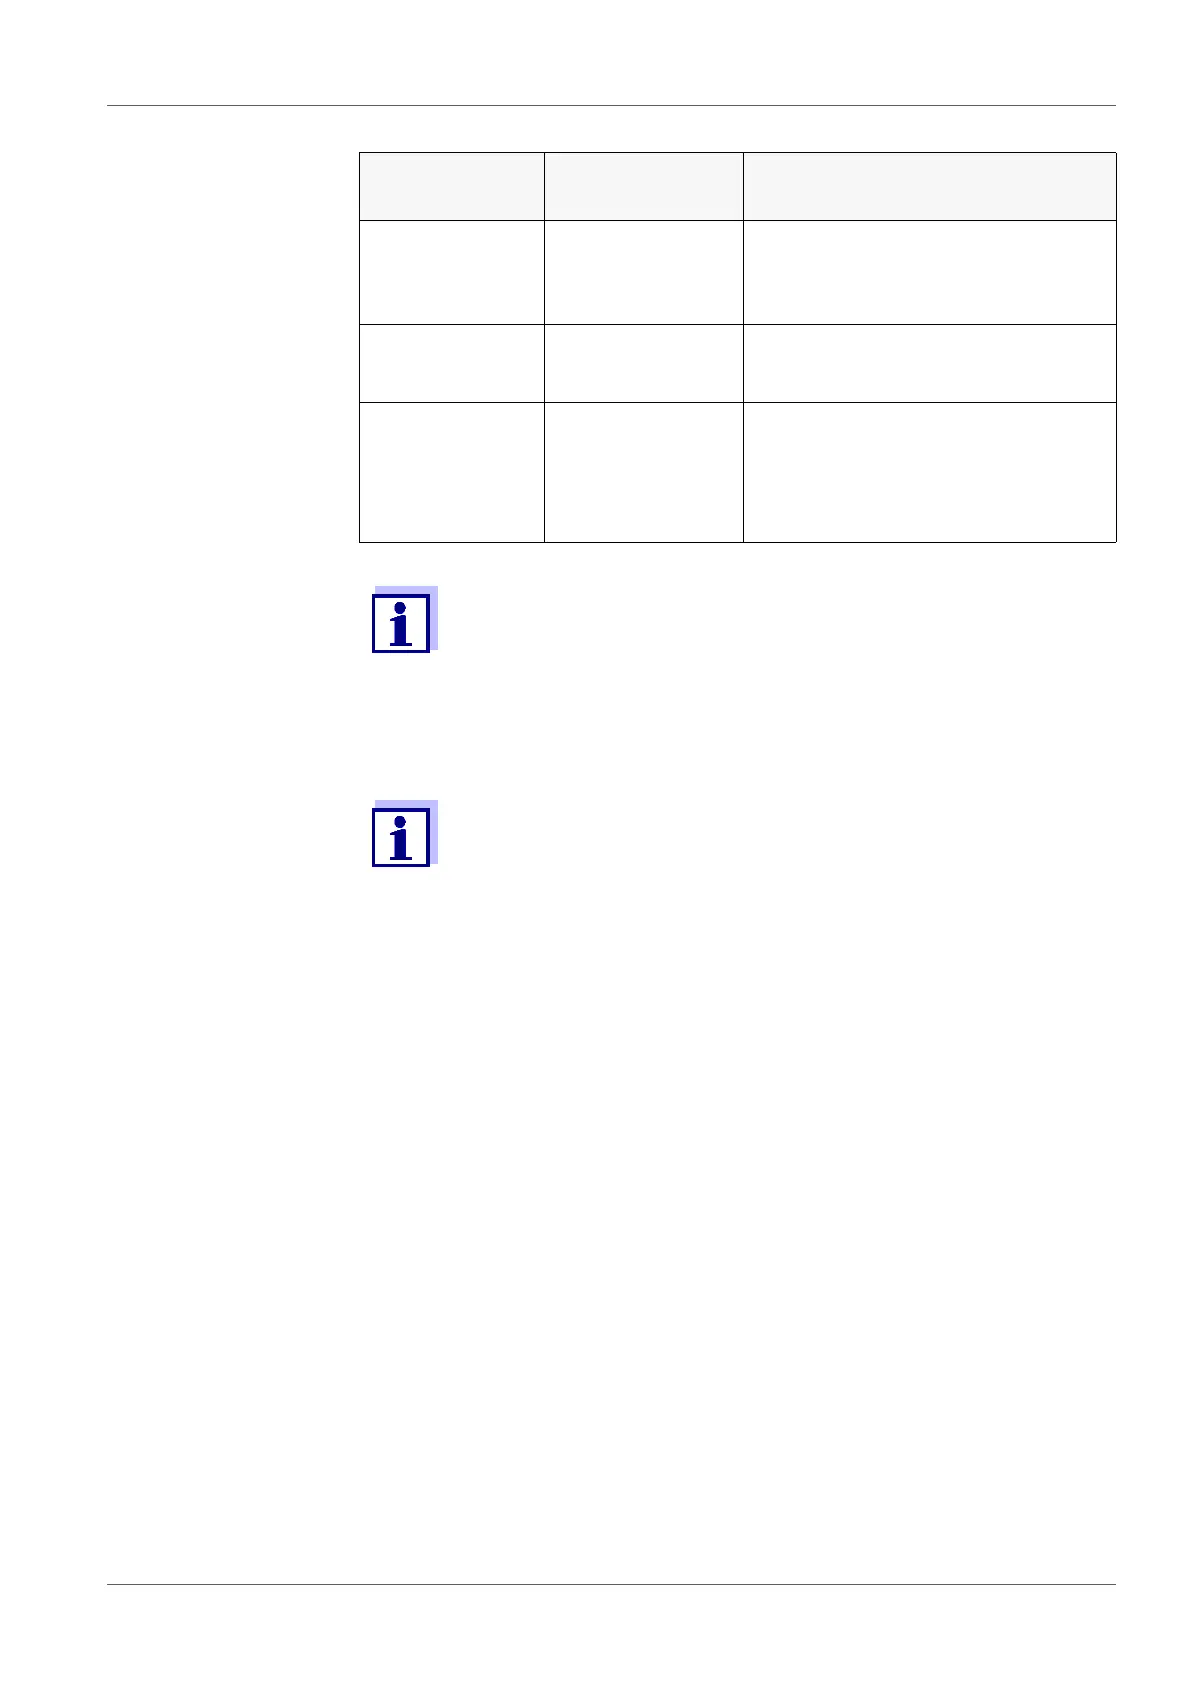
Calibration Determined val-
ues
Displayed calibration data
1-point Asy Zero point = Asy
Slope = Nernst slope
(-59.2 mV/pH at 25 °C)
2-point Asy
Slp.
Zero point = Asy
Slope = Slp.
3-point to 5-
point
Asy
Slp.
Zero point = Asy
Slope = Slp.
The calibration line is calculated by
linear regression.
You can display the slope in the units, mV/pH or % (see section
11.1.1 S
ETTINGS FOR PH MEASUREMENTS, page 93).
The calibration record is automatically transmitted to the interface
after calibrating.
 Loading...
