4
Basic Operations
- 4.3
Home Screen
14
4
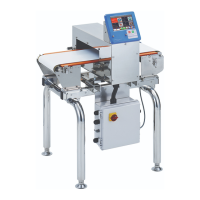
This screen displays bar graphs and peak values indicating the product effects classified by Fe, SUS and P.
The inspection result ("PASS" or "FAIL") is displayed in the right upper corner of the screen.
Touch the "Display " icon to switch the "Lissajous graph" screen.
1
2
3
4
Fig. 113 BBar Graph Screens
The product effect of type "I".
The product effect of type "Q".
The product effect of type "P".
Peak ratio of the product effect in relation to the sensitivity setting value.
Table 11 TTypes of Product Effect
The minimum phase of the product effect.
Refer to "
7.2.2. Inspection Phase Settings Screen (Phase Tab)
"
2
1 3
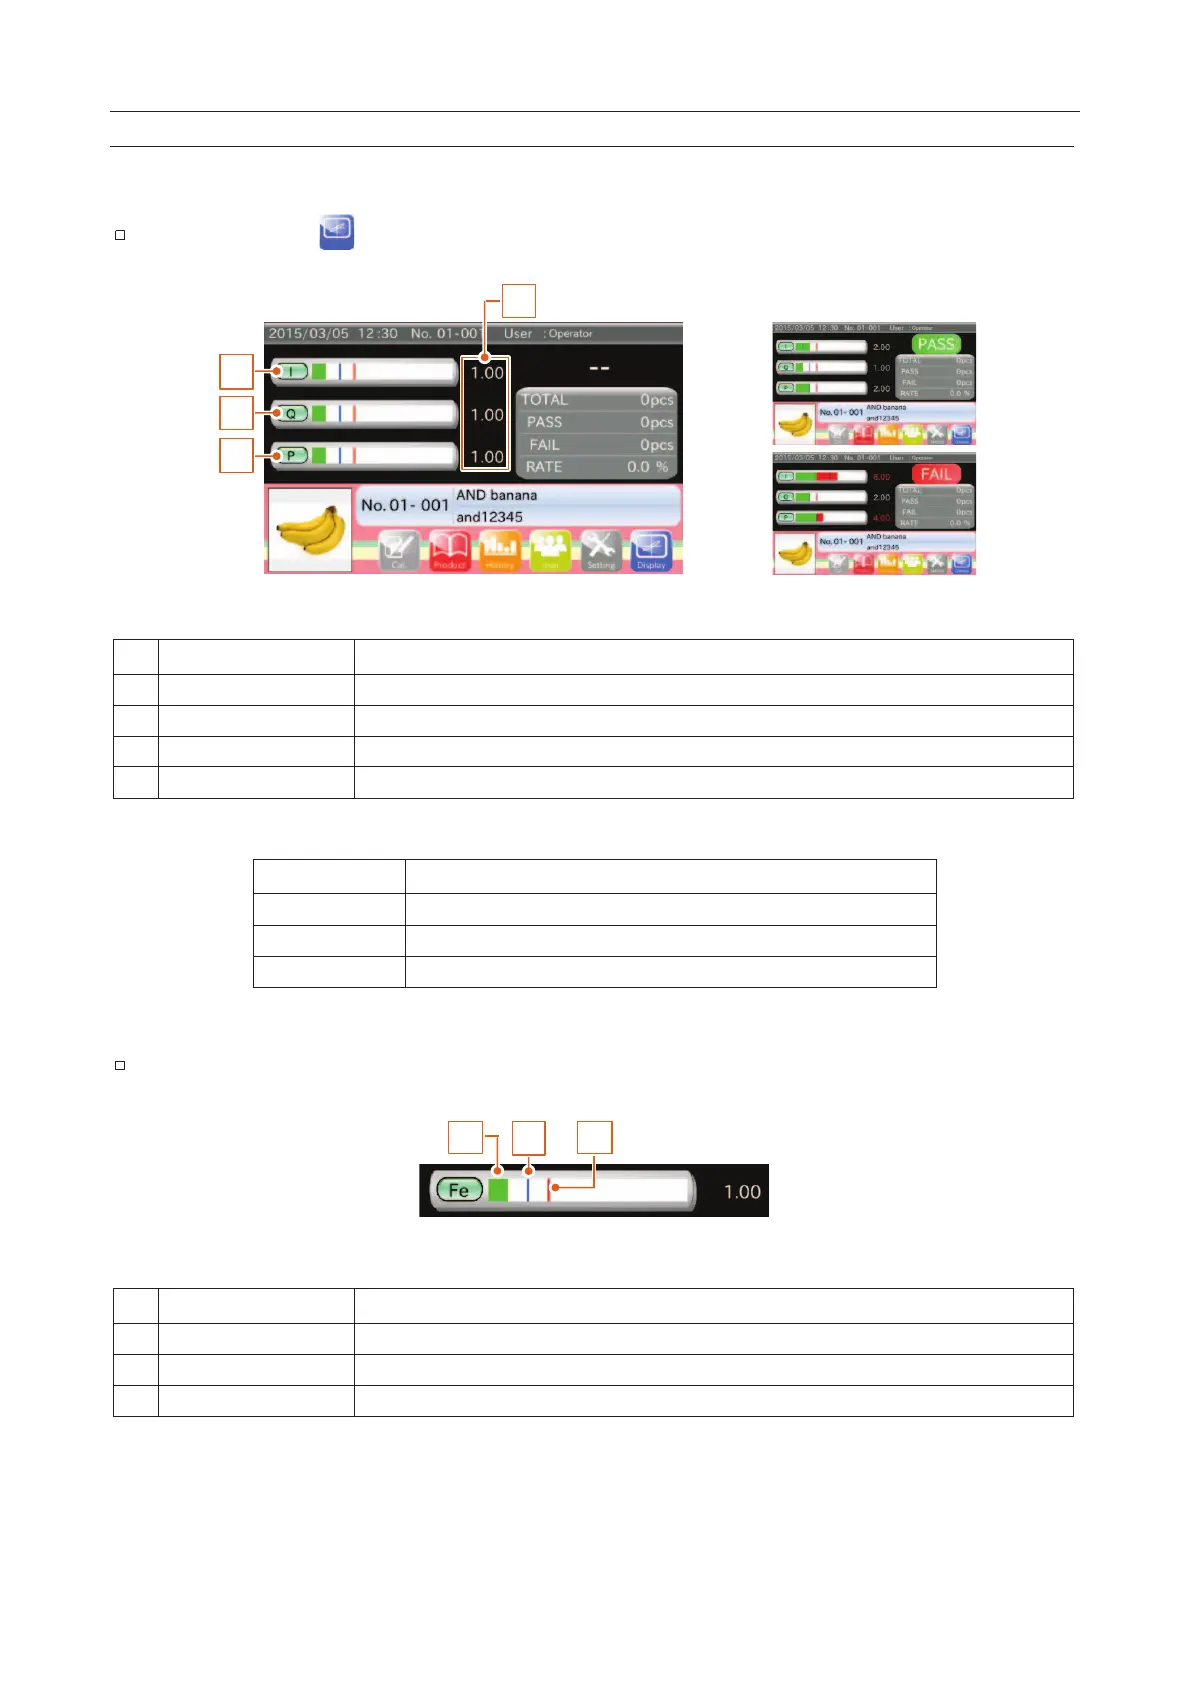
Green line or red line shows the product effect.
Blue line shows the peak of the product effect.
Red line shows the division between good products and defective products