3-12
CELL-DYN
®
3200 System Operator’s Manual
9140181H—October 2001
Principles of Operation
Flow Cytometry
Section 3
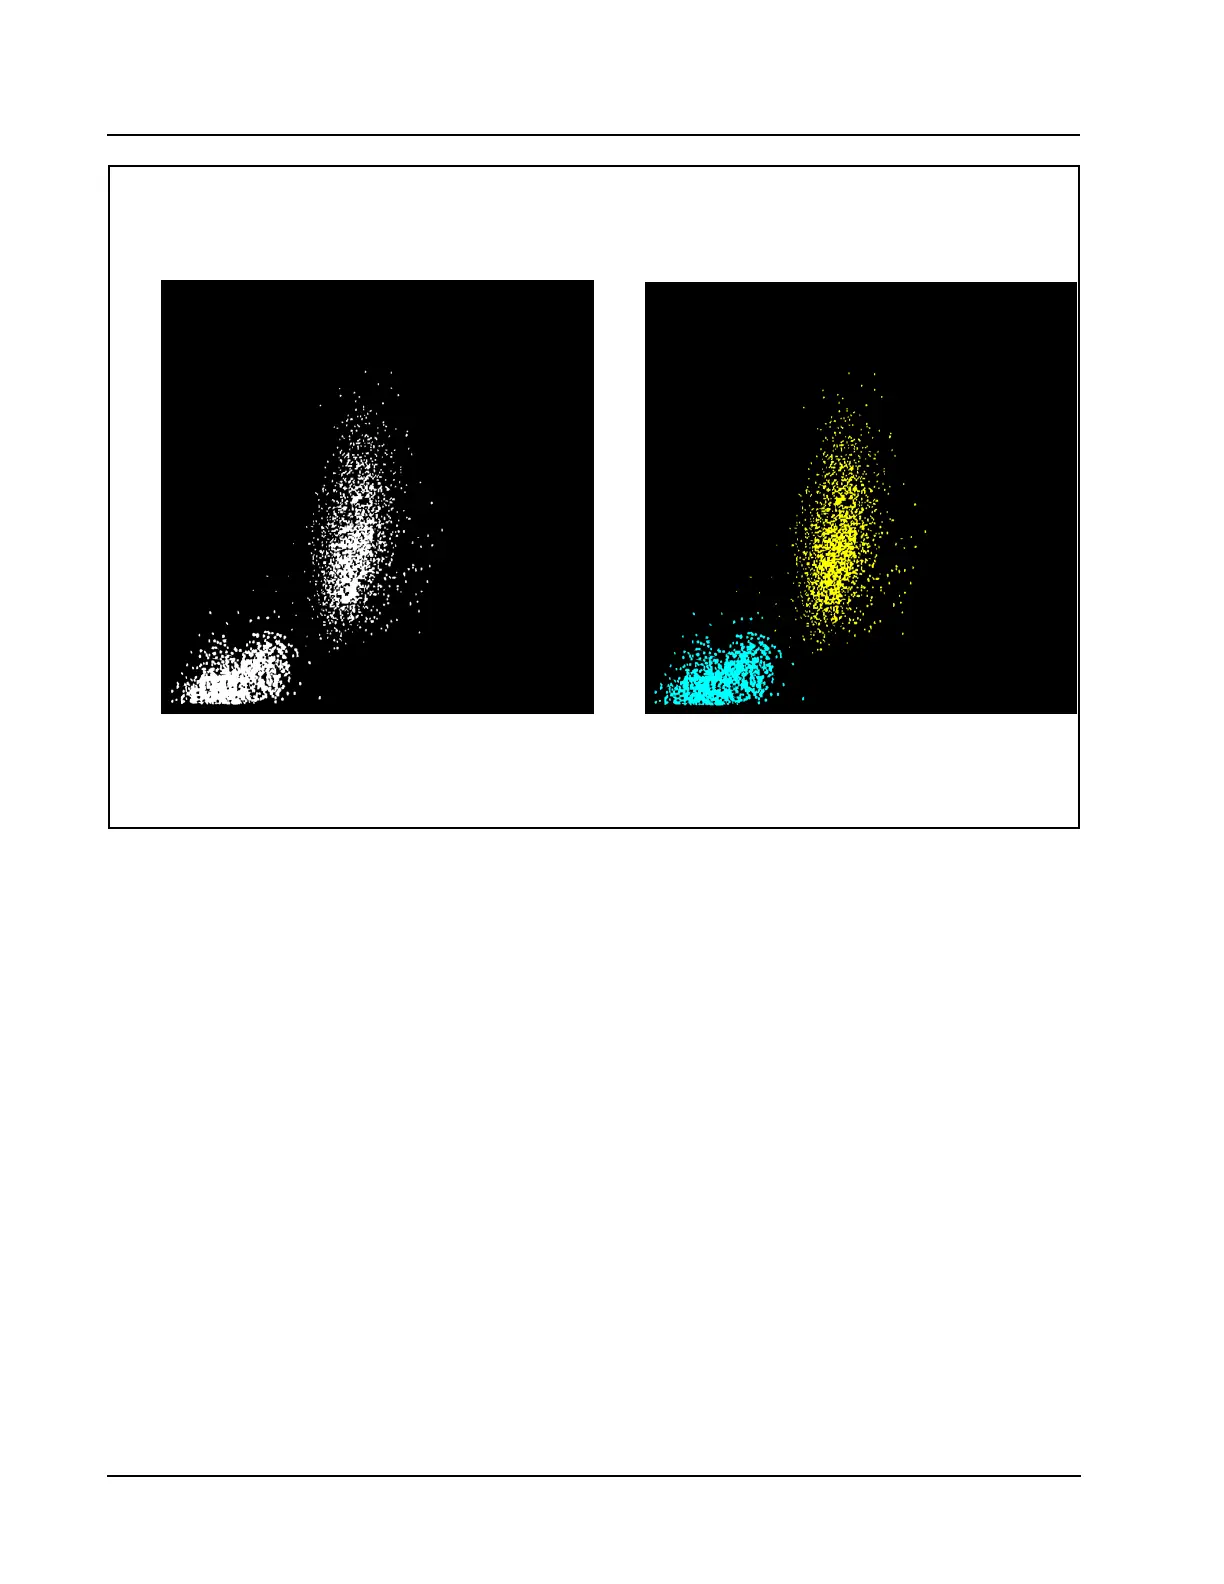
Figure 3.4 Mononuclear-Polymorphonuclear Scatter
Mononuclear-Polymorphonuclear Separation
The scatter information is plotted with the 90° scatter on the Y axis and the 10°
scatter on the X axis. (The 90°/10° scatterplot is shown in Figure 3.4.) Two
populations of cells are clearly seen on the display. The mononuclear cells fall in
the cluster in the lower left corner of the scatterplot and the polymorphonuclear
cells fall in the cluster above and to the right of them.
The instrument uses a dynamic threshold to determine the best separation between
the two populations. Each cell is then identified as a MONO or a POLY. Once each
cell is identified, it retains this classification no matter where it appears on other
scatterplots.
Mononuclear – Polymorphonuclear
Separation
Mononuclear – Polymorphonuclear
Identification
90° Lobularity
90° Lobularity
10° Complexity 10° Complexity