CELL-DYN
®
3200 System Operator’s Manual
3-13
9140181H—October 2001
Section 3 Principles of Operation
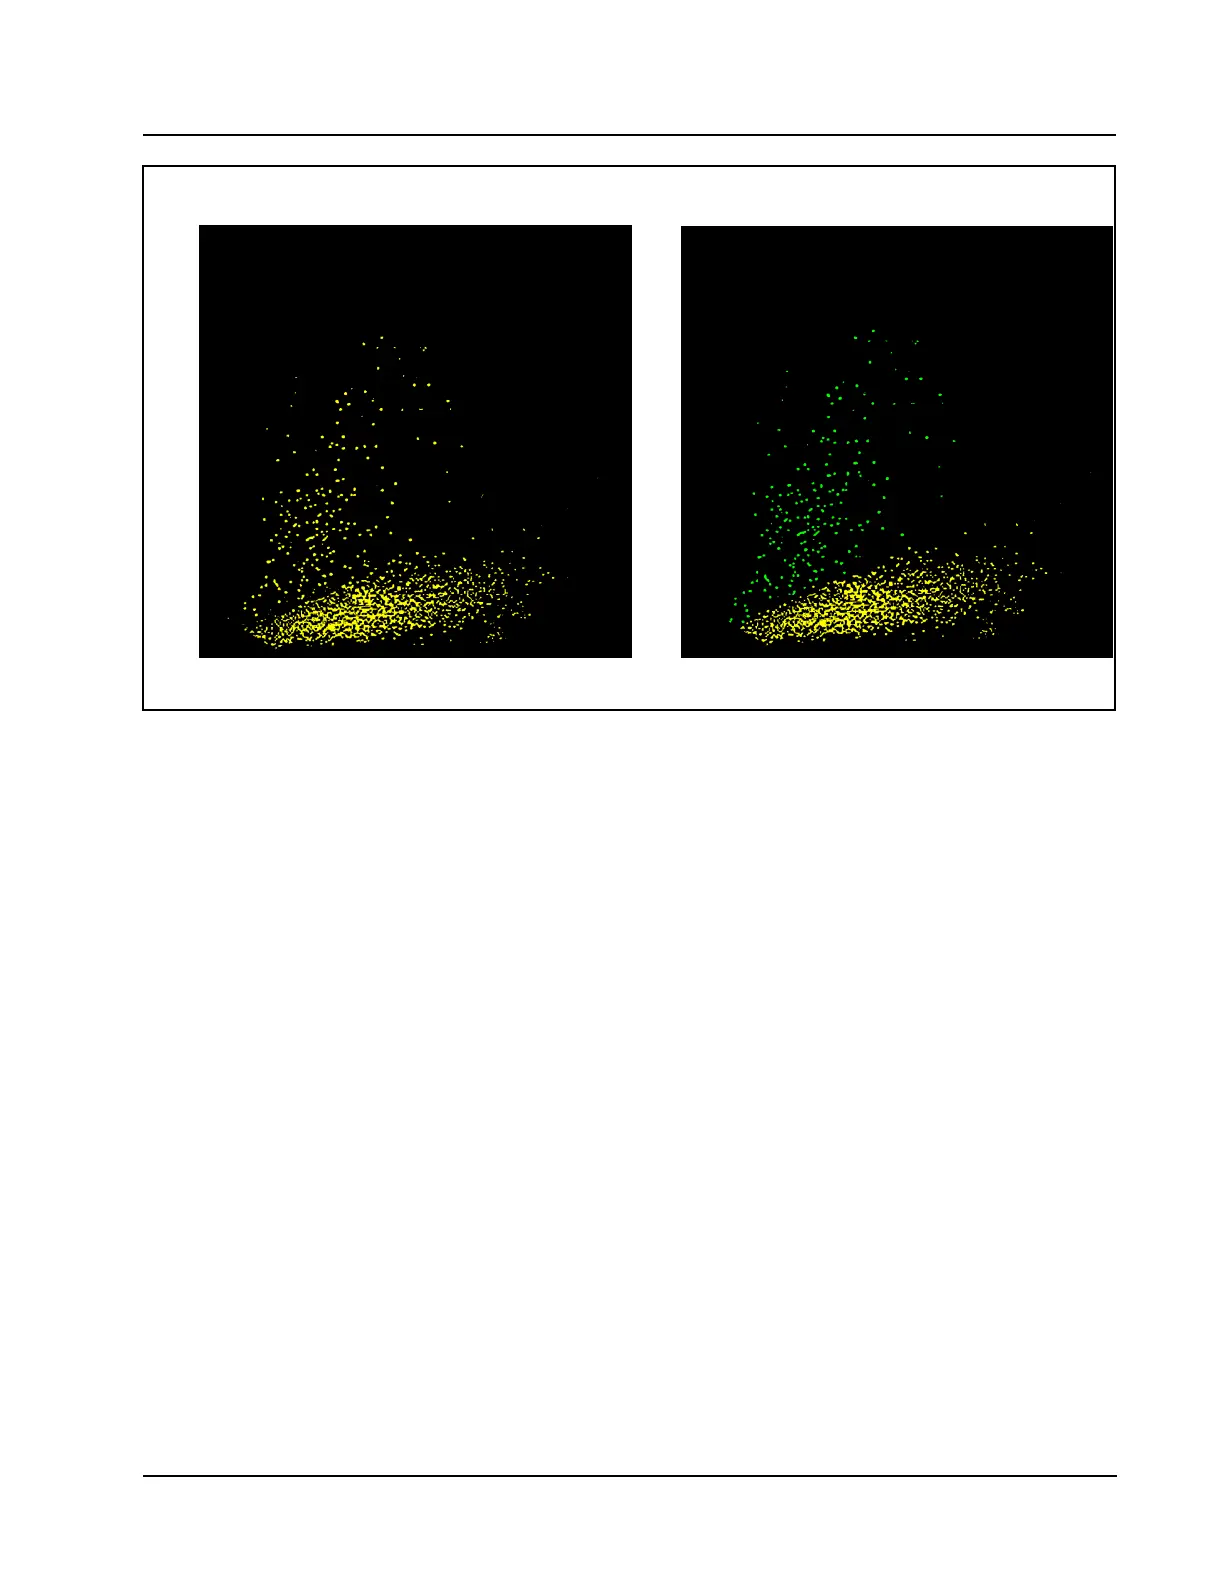
Figure 3.5 Neutrophil-Eosinophil Scatter
Neutrophil-Eosinophil Separation
The scatter information is plotted with the 90°D scatter on the Y axis and the 90°
scatter on the X axis. (The 90°D/90° scatterplot is shown in Figure 3.5.) Only the
polymorphonuclear cells are plotted on this scatterplot. The mononuclear cells have
been identified and therefore do not interfere in the further classification of the
polymorphonuclear cells.
Two populations of polymorphonuclear cells are clearly seen on the display. The
neutrophils fall in the lower of the two clusters. The eosinophils fall in the upper
cluster. The instrument uses a dynamic threshold to determine the best separation
between the two populations. Each cell is then classified as a NEUT or an EOS.
All cells scatter a certain amount of 90°D light. The eosinophils scatter more 90°D
light than any of the other cells because of the unique nature of granules they
contain. This property of the eosinophils is used to positively identify them and
thus clearly differentiate them from the neutrophil population.
90° Depolarized Granularity
90° Lobularity90° Lobularity
90° Depolarized Granularity
Neutrophil – Eosinophil
Separation
Neutrophil – Eosinophil
Identification