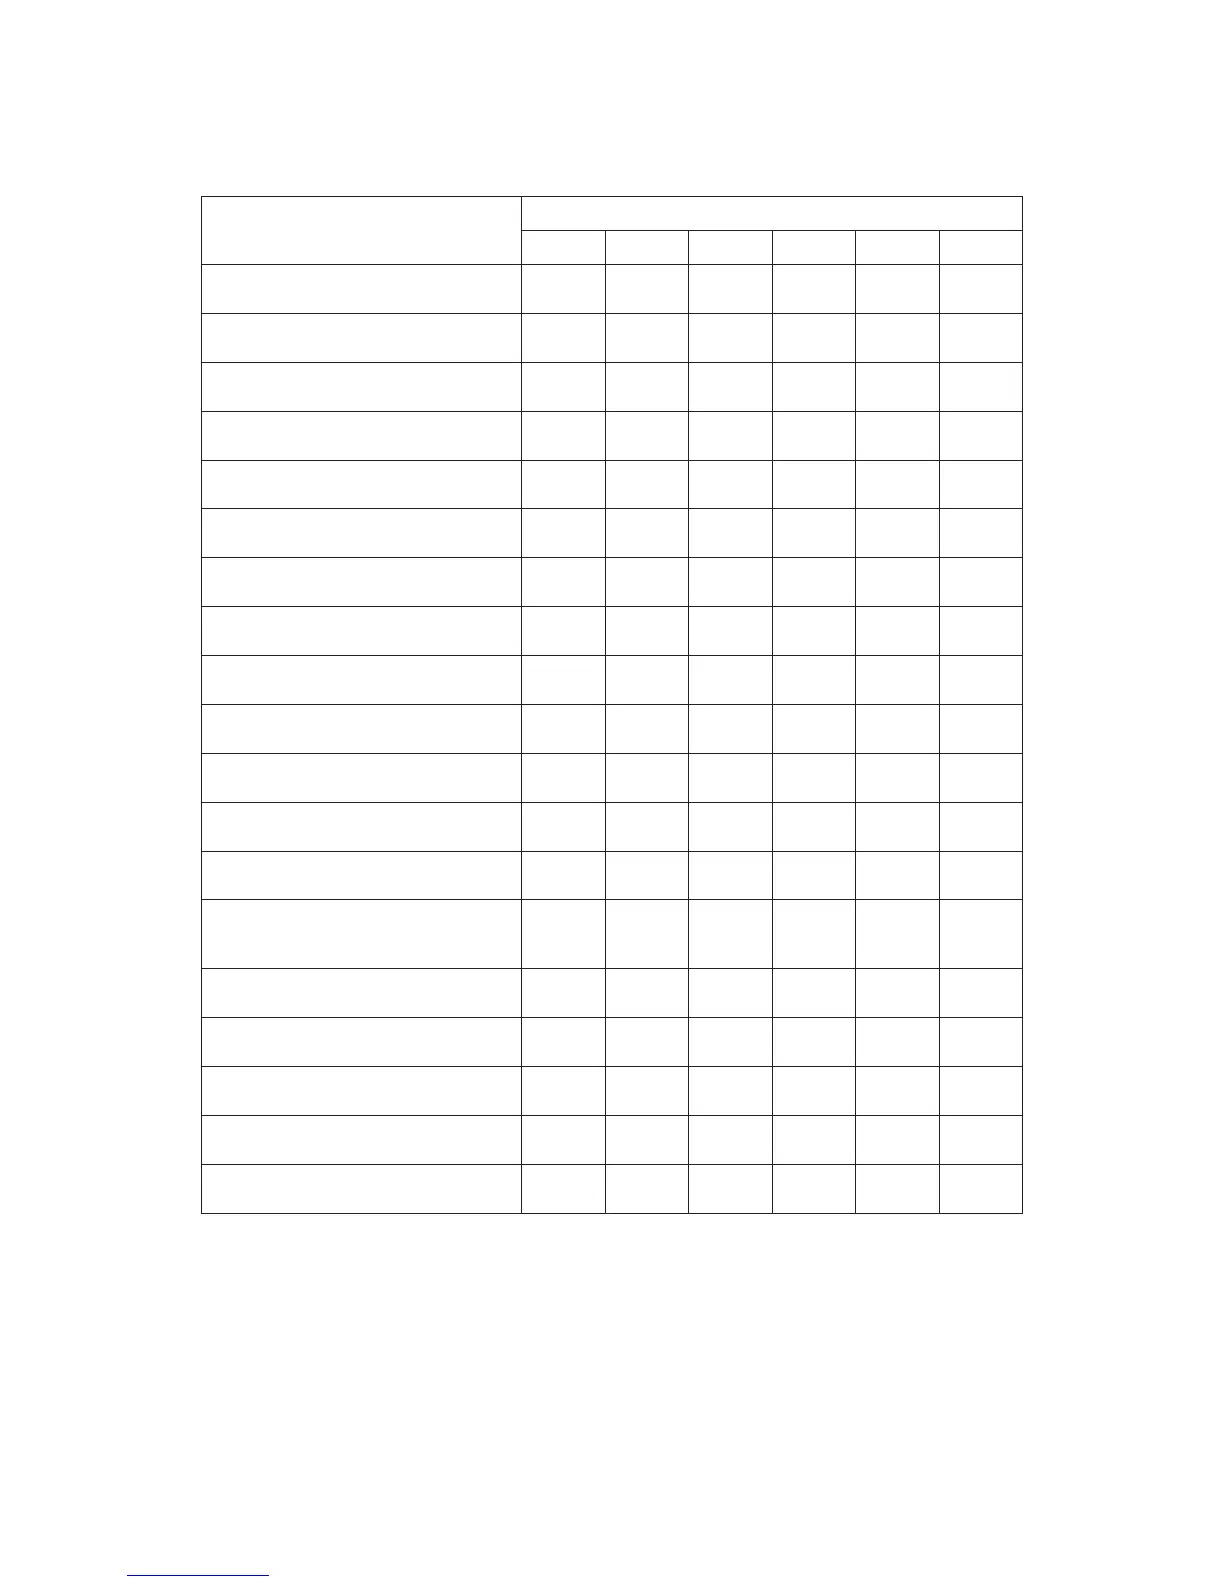
Table 6-2. Measurement Results for each Instrument Mode
Measumrent Data INSTrument:SELect
CALC:FEED command FFT
CORR HIST ORD OCT SINE
Auto correlation
XTIM:CORR [1|2|3|4]
X
Capture buffer
TCAP [1|2|3|4]
XXXXX
Coherence
XFR:POW:COH [1,2|1,3|1,4|3,4]
X
Composite Power
XFR:POW:COMP [1|2|3|4]
X
Cross Correlation
XTIM:CORR:CROS [1,2|1,3|1,4|3,4]
X
Cross Spectrum
XFR:POW:CROS [1,2|1,3|1,4|3,4]
XX
Cumulative Density Function
XTIM:VOLT:CDF [1|2|3|4]
X
Data Register
[D1|D2|D3|D4|D5|D6|D7|D8]
XXXXXX
Frequence Response
XFR:POW:RAT [2,1|3,1|4,1|4,3]
XX
Histogram
XTIM:VOLT:HIST [1|2|3|4]
X
Linear Spectrum
XFR:POW:LIN [1|2|3|4]
XX
Normalized Variance
XFR:POW:VAR [1|2|3|4]
X
Orbit Diagram
XVOL:VOLT [1,2|1,3|1,4|3,4]
XX
Order Track
XORD:TRACK
[1|2|3|4],[1|2|3|4|5]
X
Power Spectrum
XFR:POW [1|2|3|4]
XXX
Probability Density Function
XTIM:VOLT:PDF [1|2|3|4]
X
RPM Profile
XRPM:PROF
X
Time
XTIM:VOLT [1|2|3|4]
XXXX
Unfiltered Time
XTIM:VOLT [1|2|3|4]
X
CALCulate
6-27

 Loading...