95
Chapter 19 - Reports
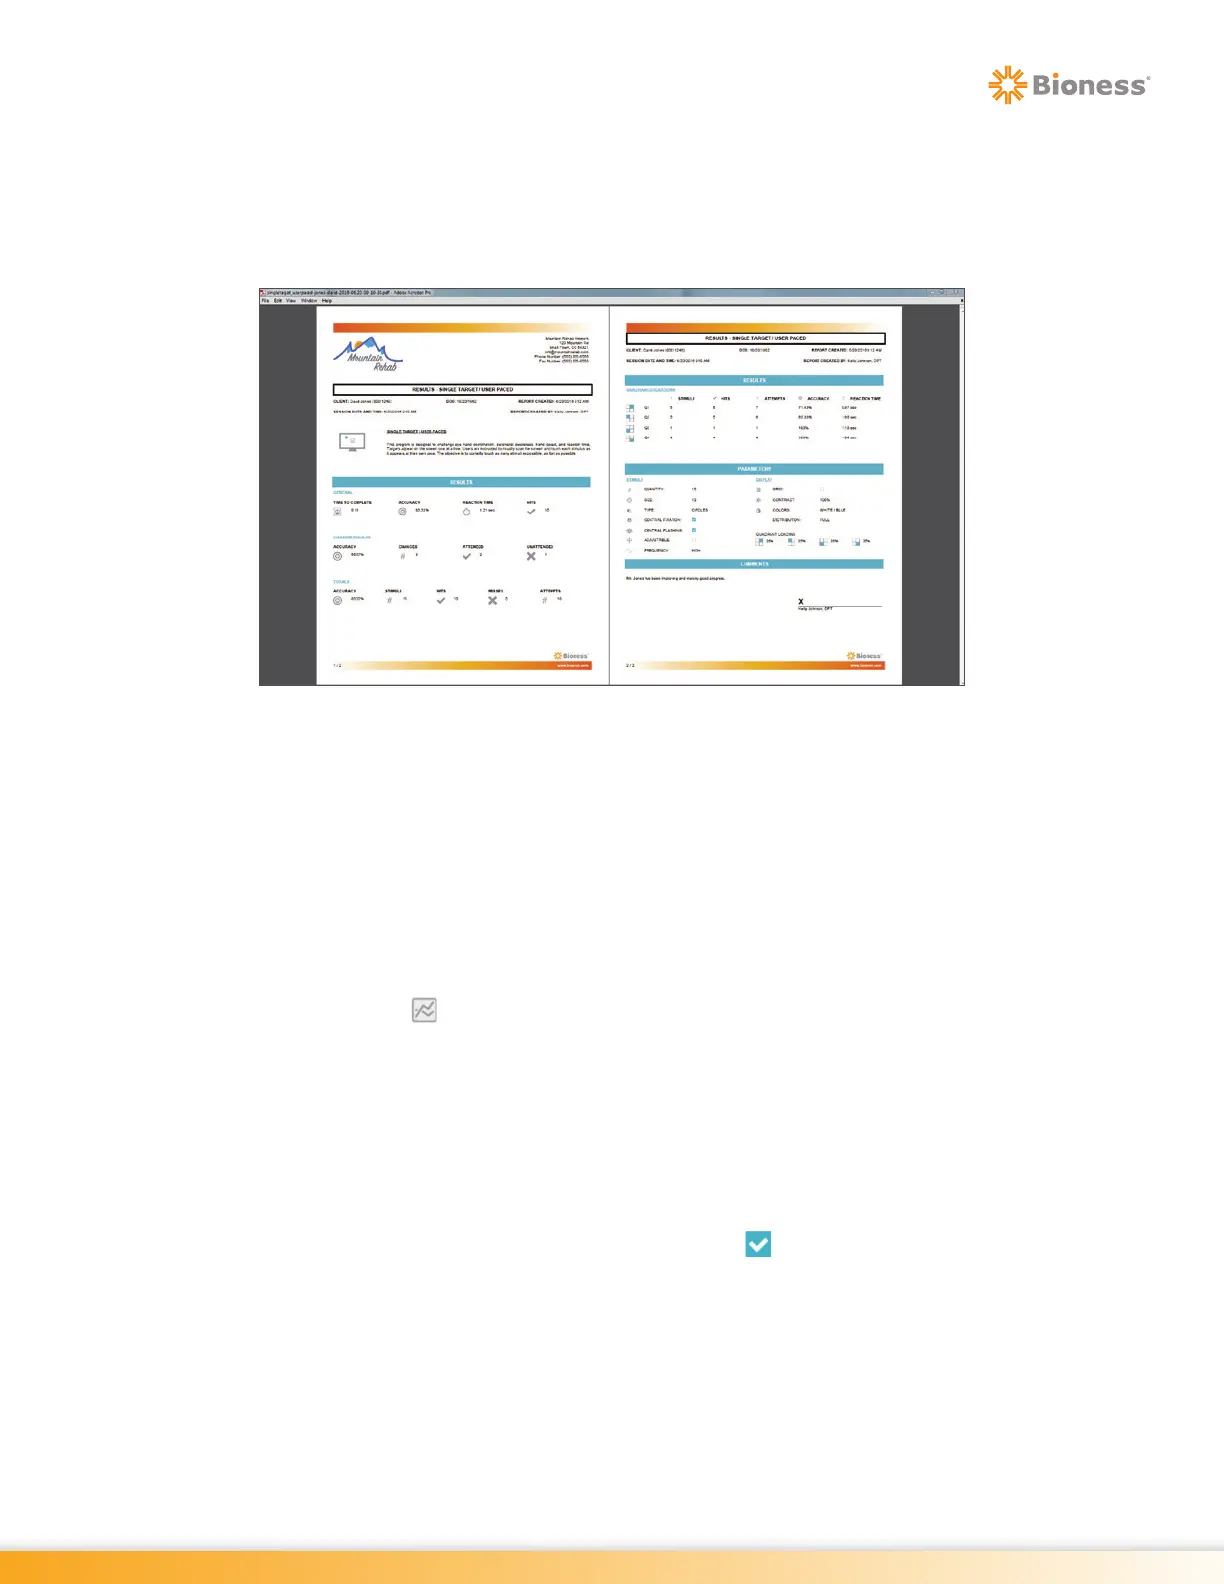
3. The Adobe Reader Program will launch and a pop up window will open displaying the PDF Report.
See Figure 19-9. The report is automatically saved to the folder C:\Users\BITS\Documents\BITS
PDF Reports\Results. The file name will include the name of the Therapy Program, the Client
Name, and the date and time at which the therapy session was performed. The PDF Report can be
printed to a hard copy using a USB connected printer.
Figure 19-9: Print Preview Screen, Example
Graphing
When a client has completed two or more Therapy Sessions over a period of time, the results can be
projected on a graph with certain results Variables displayed on the y-axis and the date displayed on the
x-axis.
Only therapy sessions performed using the same parameter profiles can be graphed together. This includes
the predefined parameter profiles (e.g. Level 1, Level 2, and Level 3), and all Custom Parameter Profiles.
This restriction ensures that the therapy results displayed and compared on the same graph are relevant
to each other. The Graph Icon displayed next to each of the Predefined Parameter Profiles indicates
that sessions performed with these profiles are graphable.
Note: Refer to the Graphable Result Variables section of this chapter to identify Variables specific to each
therapy program.
To create a graph:
Note: The number of Sessions selected will be indicated at the bottom of the Sessions List Screen.
1. From the Sessions Results List Screen, identify the therapy sessions that should be displayed on
the graph, and select one of them by touching the Check Box in the rightmost column. Selecting
one session to be displayed on the graph will automatically eliminate the Check Boxes for all
sessions that are not comparable to the selected session.
2. The Select all of the other sessions that should be displayed on the graph. This can be done one at
a time, or all comparable sessions can be selected by touching the box at the top of the column in
the header row. See Figure 19-10.