98
Clinician's Guide
Graph Area/Ring Results
1. Some Therapy Programs in Balance Therapy Category provide results regarding the client's
performance in each area/ring displayed in the touchscreen.
2. Area results correspond to client's movement in posterior, anterior, left and right movements. Rings
results correspond to center, first, second and fourth rings presented on screen.
3. To graph these results on one graph, select the Area or Ring Results Radio Button.
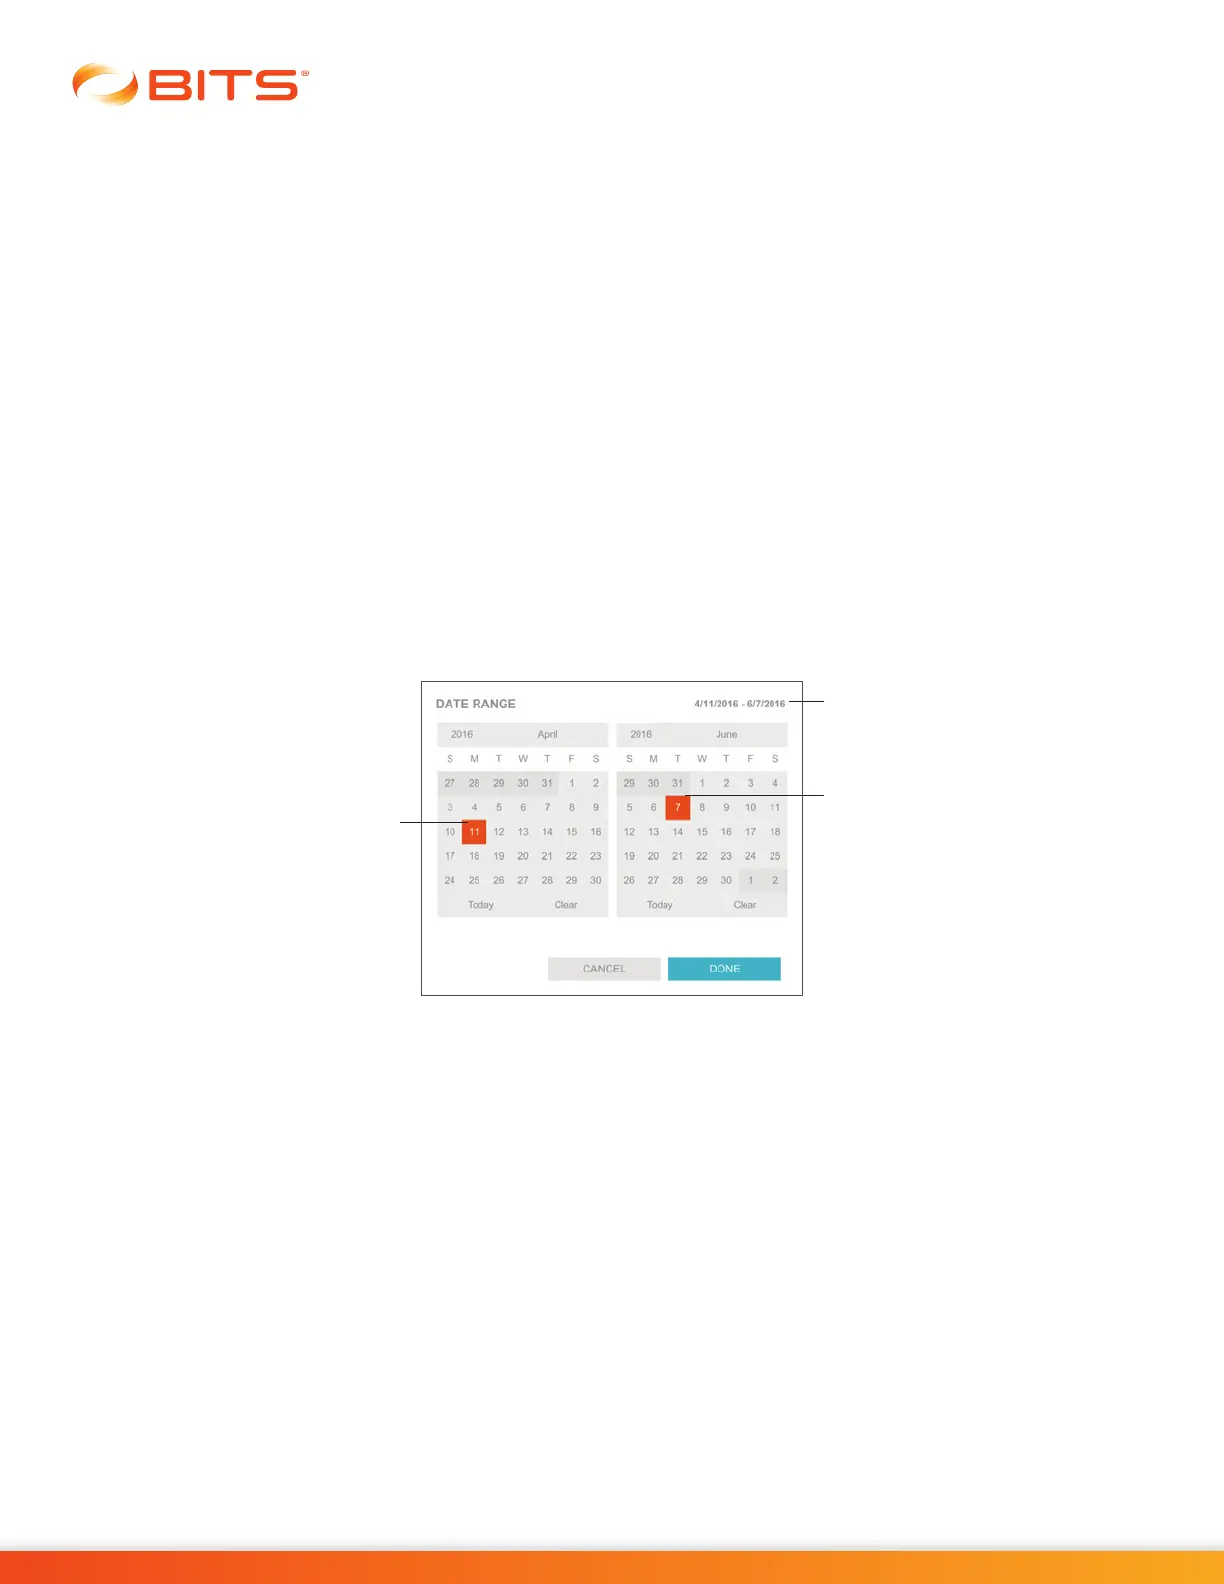
Adjust the Date Range
1. The date range of the graph can also be dynamically adjusted. Select the text box for the beginning
or ending date. See Figure 19-13.
2. Select the date range for the graph in the Date Range Window. See Figure 19-15.
3. Enter the date in the appropriate format. The graphs will change dynamically.
Note: When multiple Sessions are performed on the same day, the data points representing the Variable
for the Sessions will be displayed in purple. The average of these values will be displayed in red, and the
graph will intersect with the average.
Figure 19-15: Date Range Window
Printing a Graph
A PDF Report including a graph displaying the Results from multiple Therapy Sessions can be created.
The printed Report will include only the Variable actively displayed on the Graph Screen.
1. From The Graph Screen press the Print Button. See Figure 19-12.
2. The Generate PDF pop up window will open. See Figure 19-16. Comments can be added to the
report by selecting the Include Comments Box and typing them into the text box provided. Press the
Done Button to generate the PDF Report.
Date Range
Selected
Selected
Beginning
Date
Selected
Ending Date