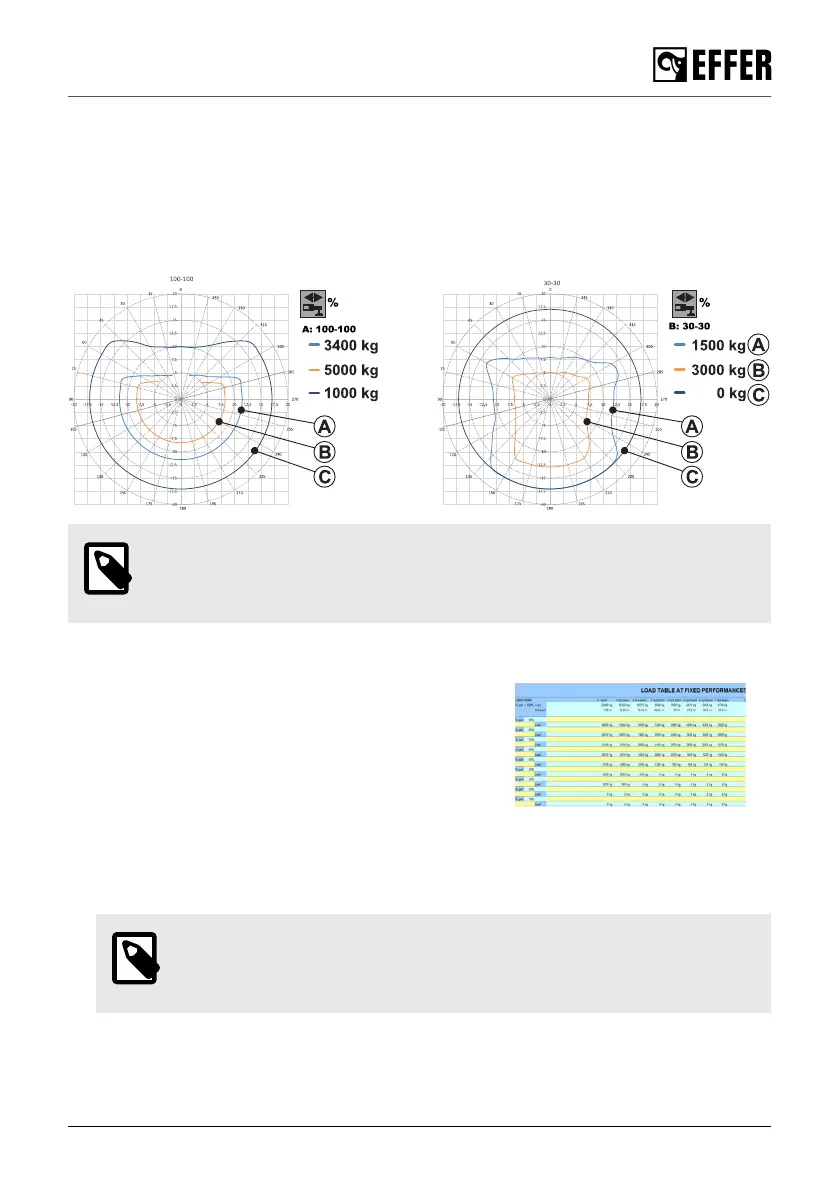
Rated capacity stability diagram
The EFFER software creates different capacity diagrams with the stabiliser extensions in different
positions (represented in the icon). For cranes with JIB, other capacity diagrams will be
automatically generated.
The software calculates three loads represented by the three coloured curves. These loads are
represented by the position of the crane in each sector (degrees) and also by the outreach of the
boom extensions (meters).
NOTE
Contact your authorised service workshop to request these diagrams for other
loads.
Load chart
In this type of diagram, the lifting performance is indicated
in a table. Each percentage (%) of the stabiliser extension
corresponds to a specific load (kg) that you can lift at a
specific outreach (m) with the specific boom.
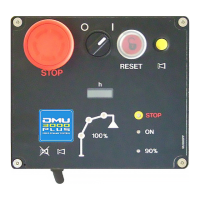
6.1.17. DLC-S Dynamic Load Chart [option]
The DLC-S allows:
a. A simulation of the stabiliser system position to display the maximum liftable loads
NOTE
This simulation can be activated either when the crane is in transport position
or in working position.
During operation
EFFER 265-315-395-525 Progress 2.0 CE 109