134
Print sensor positions: Information on the trigger sensor and vibration
sensors is included in the report.
Print measurement details: The individual steps of the balancing
measurement, the amplitude and phase of the vibration, the time of
measurement and the rotational speed are documented in the report.
Print suggested weights: The suggested weights are documented.
Print measurement coefficients: The coefficients determined during
balancing are also displayed.
Print measurement results: The start and end of the imbalance amplitude, the
imbalance reduction and information on the balance weights determined are
included.
Click on OK to create the report. The report window opens.
You can use the toolbar to control the screen display:
The display size can be defined inView. Select Percent adjustable to enter a
zoom factor expressed as a percentage in the Percent input field.
You can navigate forwards or backwards through the report and also jump to
the start or end of the report using the arrow buttons.
Click on to print out the report.
Further information under Add balancing configuration .
4.14.5 Amplitude/phase report
To create an amplitude/phase report, select an element in your system tree and
click Amplitude/phase report in the Service menu. The report will be created for
all amplitude/phase configurations contained in the element that is selected.
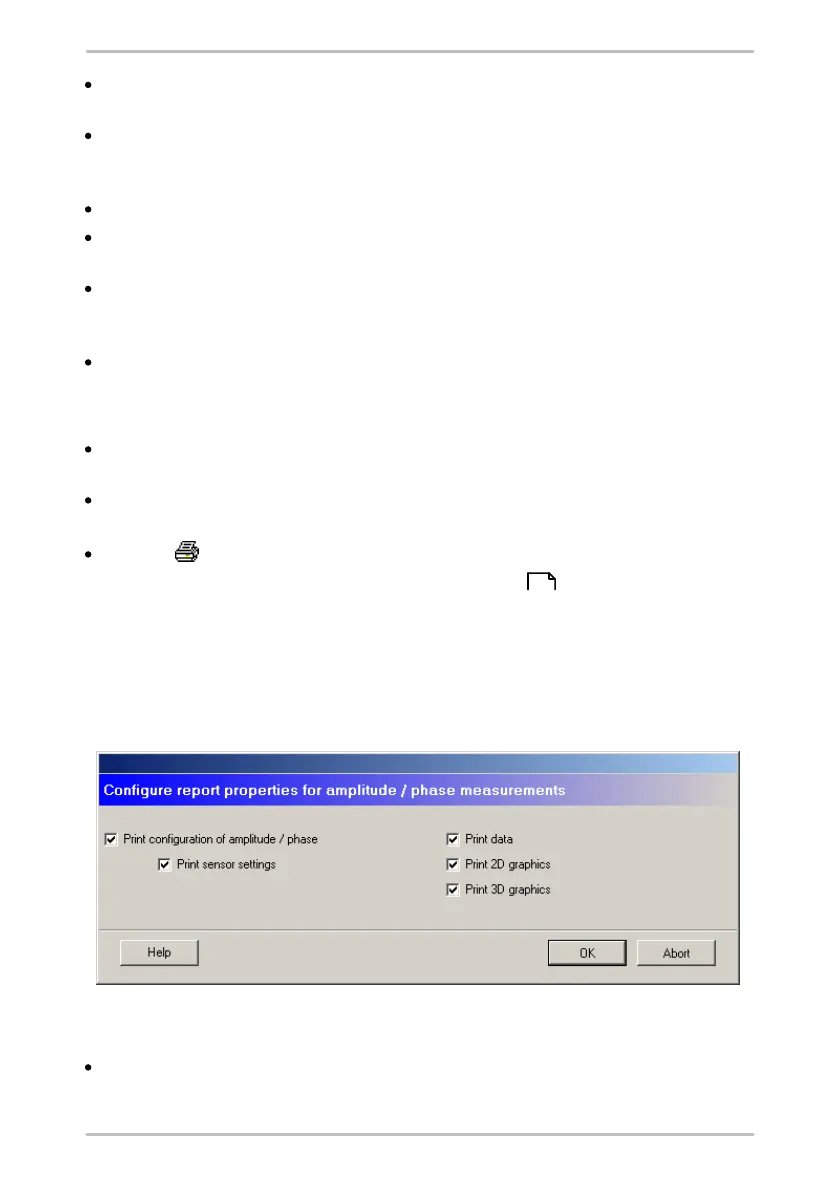
Selecting data for the report
Print amplitude/phase configuration: If this option is selected the settings for
the amplitude/phase configuration are printed. In order to print the sensor
69