231
Detector III
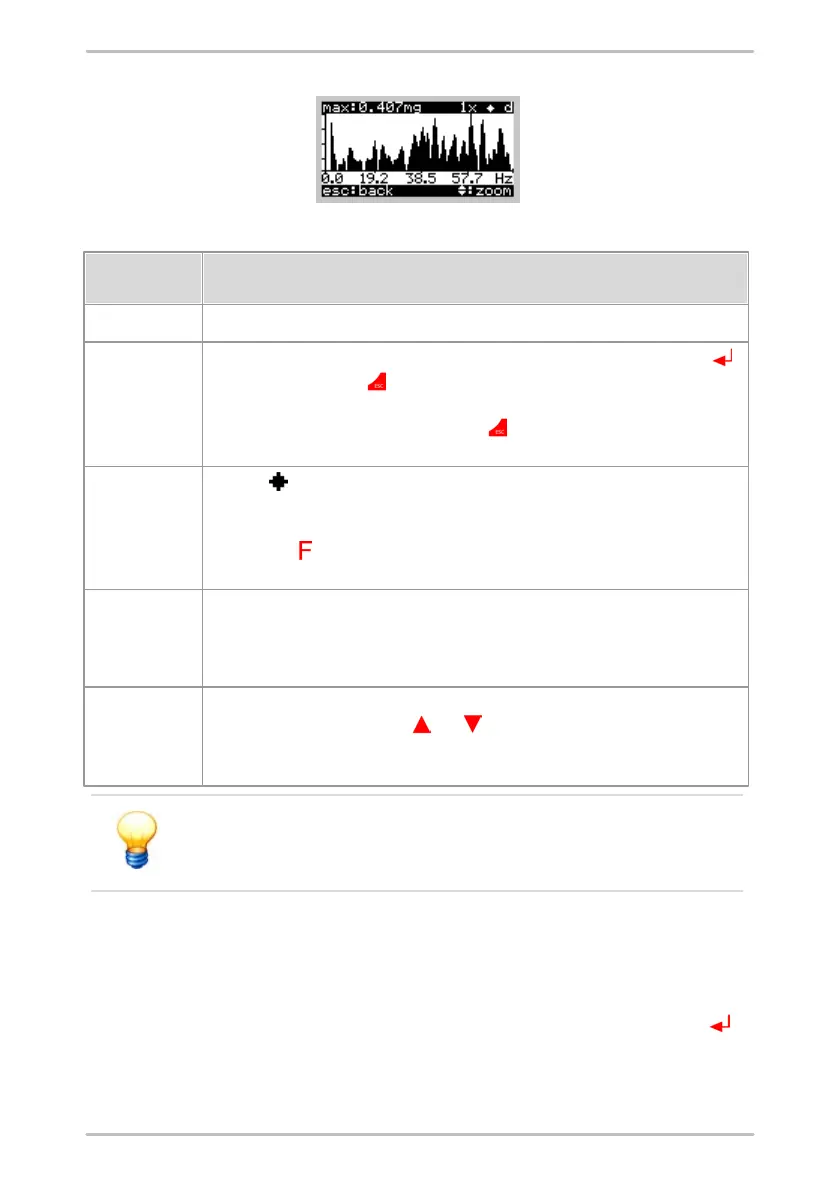
The following data is displayed:
The value of the highest peak is displayed in the current window.
This shows the zoom factor, which can be changed by pressing the Enter button
(zoom in) and Esc button (zoom out). The zoom factor can be set to 0.1x – 0.4x –
1x – 2x – 4x – 8x. With a zoom factor of 8x it is possible to read the frequency value
for each peak. When pressing the Esc button in the FFT overview window (zoom
factor 0.1x), the Detector leaves the FFT display and returns to the time signal display.
When the symbol is displayed, the auto-scaling mode is enabled. If so, the peaks
in a window are scaled in a way to fit the largest peak in the display. If the symbol is
not shown, the scaling remains the same for all screens and zoom factors. Press the
function button to enable/disable auto-scaling. When switching off auto-scaling, the
zoom factor is set back to 0.1x.
This character shows which FFT is displayed:
a: acceleration
v: velocity
d: demodulation
Here you can see the frequency range of the window, which is currently being
displayed. Press the cursor key and to scroll left or right resp. This does not
work when the zoom factor is 0.1x, because the whole frequency range is already
shown.
FFTs are only displayed on the Detector to give a first quality
assessment of measured data. The detailed analysis is performed
with the Trendline software.
6.7.4 Multiple measurements
You can measure the same measuring point multiple times using the Detector.
For this select a measurement which you have already measured and measure
again like described before. After the measurement, press the Enter button to
save the data. Then the following menu appears: