160
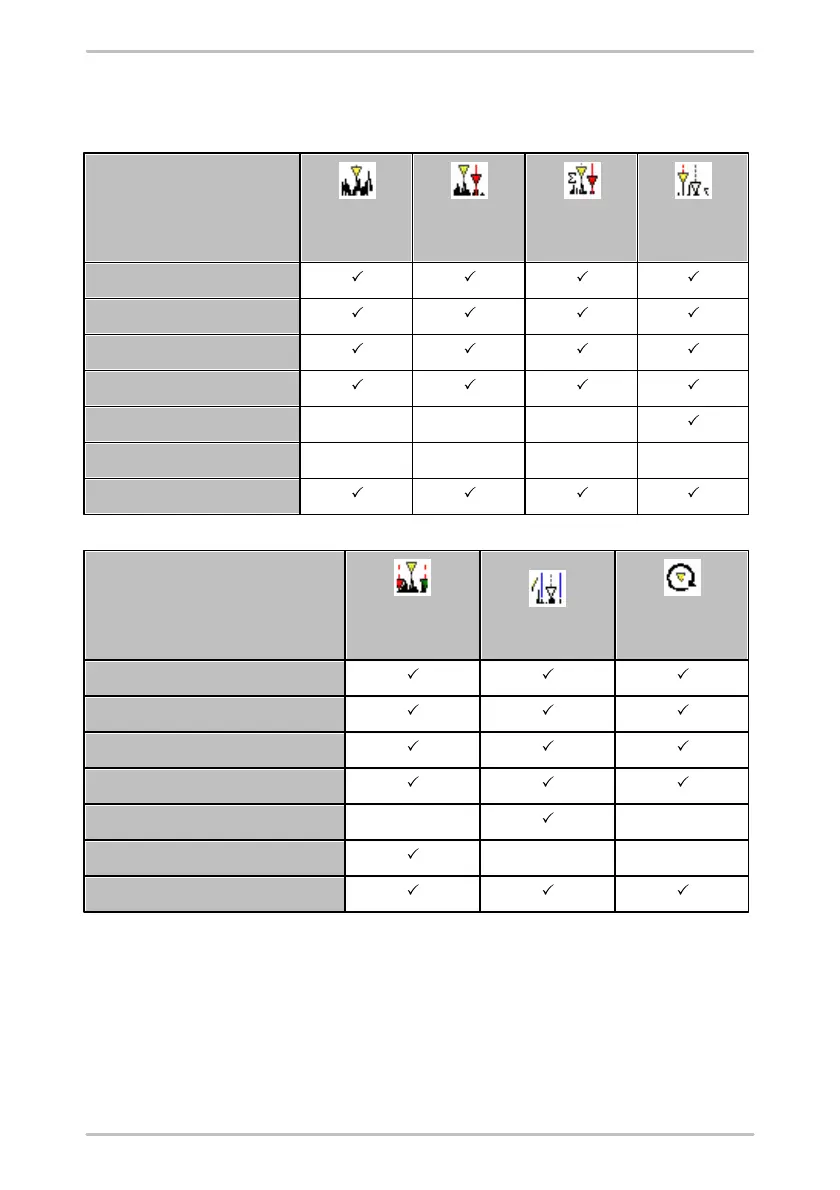
The table below provides an overview of the corresponding information displayed
with the active cursor type for FFT diagrams in the diagram information bar:
Information displayed in
the diagram
information bar
Information displayed in the
diagram information bar
The Measure cursor shows the same information as displayed by Difference
and RMS/AMV cursor plus Min/Max. Diagram information and comments for time
signals and trend diagrams are displayed in the diagram information bar
irrespective of the cursor type selected. Further, information on the alarm values
of the data set currently open is displayed in the trend diagrams.