172
2.
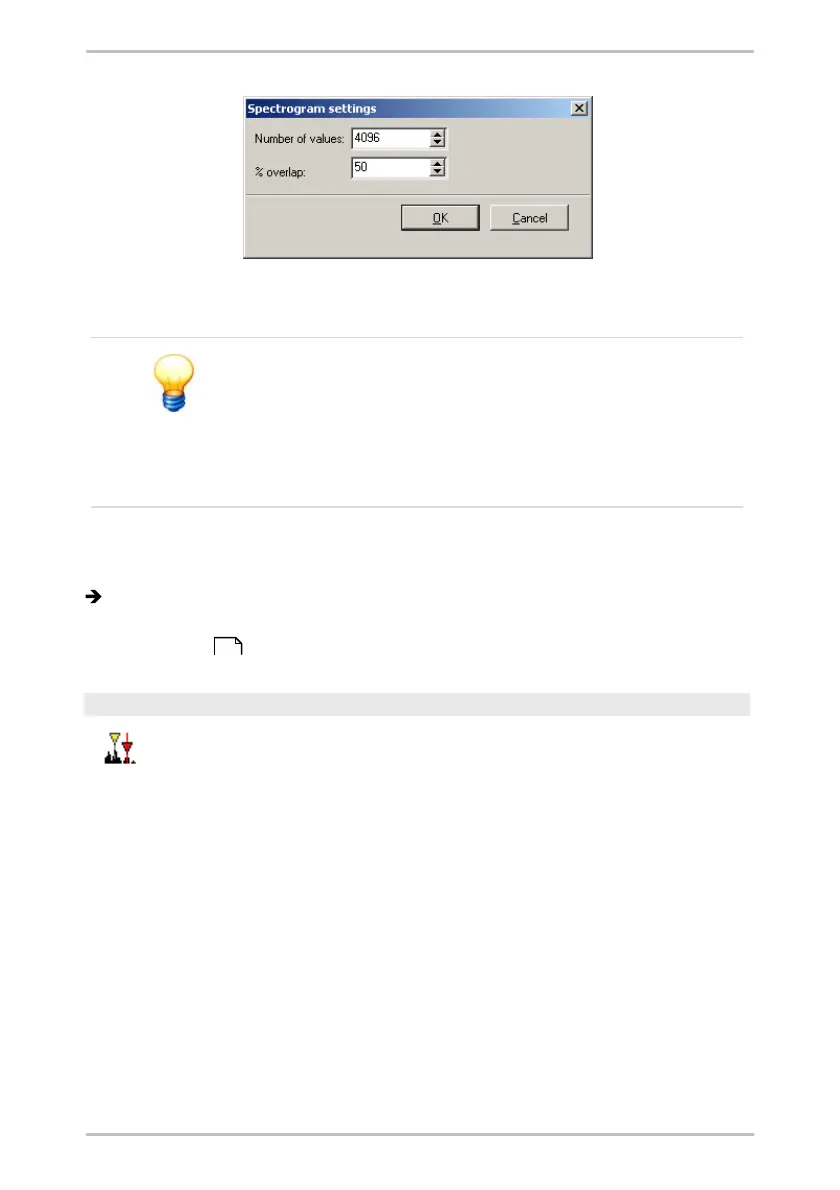
Enter the Number of values you want to calculate the spectrum for. The pre-set
value is equal to the maximum applicable value.
The number values you enter for the calculation will be
increased automatically to the next power of two.
Example: If you want to calculate a spectrogram for 1000
measure values, the calculation value will be set to 1024
automatically. The calculated FFT will contain 512
measure values.
3.
Define % overlap.
4.
Click on OK.
The spectrogram is shown in the "Calculated FFT" diagram.
You can change the display under FFT settings in the work interface area (see
Waterfall charts ).
Difference cursor
You can use the difference cursor to calculate the difference between
two measured values.
To do this, place the base cursor and a difference cursor at the desired
measuring points in the diagram. The distance between the cursors is
indicated by a colored bar directly above the x-axis. Both measured
values obtained with the cursors and the resulting differential values
are displayed in the cursor information.
198