229
Detector III
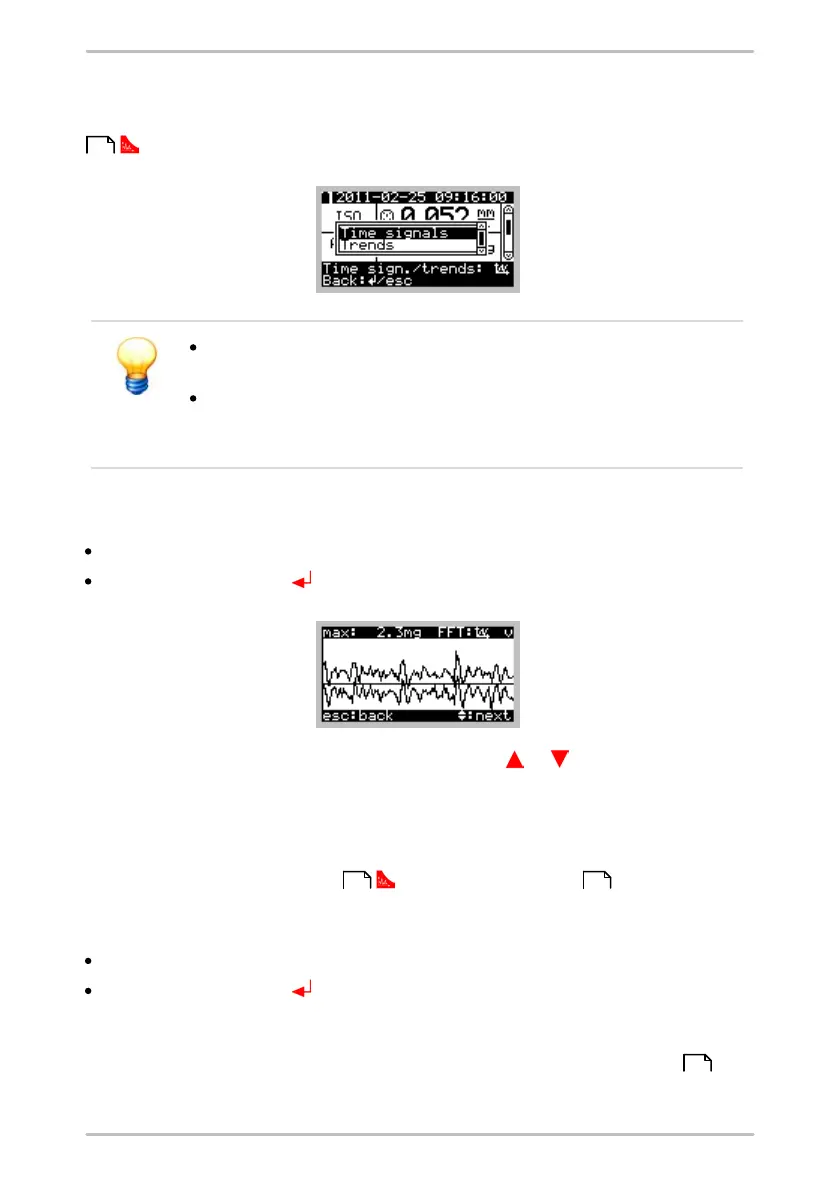
6.7.3.1 Display of time signals / trends
You can go to the time signal/trend selection by pressing the time signal button
in the measured value view.
The time signal and trend selection is available when time
signals or trends for at least one characteristic value exist.
Time signals and Trends are only displayed on the Detector to
give a first quality assessment of measured data. The detailed
analysis is performed with the Trendline software.
Display time signals
Select Time signals and
press the Enter button .
When viewing the time signal, press the cursor key or to switch between the
several time signals. A horizontal line in the diagram indicates the zero line. At the
top right side a character is displayed (a for acceleration, v for velocity and d for
demodulation) to indicate the type of time signal. At the top left the maximum
value of the highest peak of all measured values is displayed.
Pressing the time signal button opens the FFT display .
Display trends
Select Trends and
press the Enter button .
On the Detector, a Trend of 2 to a maximum of 20 characteristic values can be
shown. Once a characteristic value is measured at least twice, a trend can be
displayed. If you want to show a trend from previous measurements , the
selected measurement is adopted as the last current value. Recent
212
212 230
228