7 Operations of CEMS2000 Monitoring Software
97
FOCUSED PHOTONICS INC
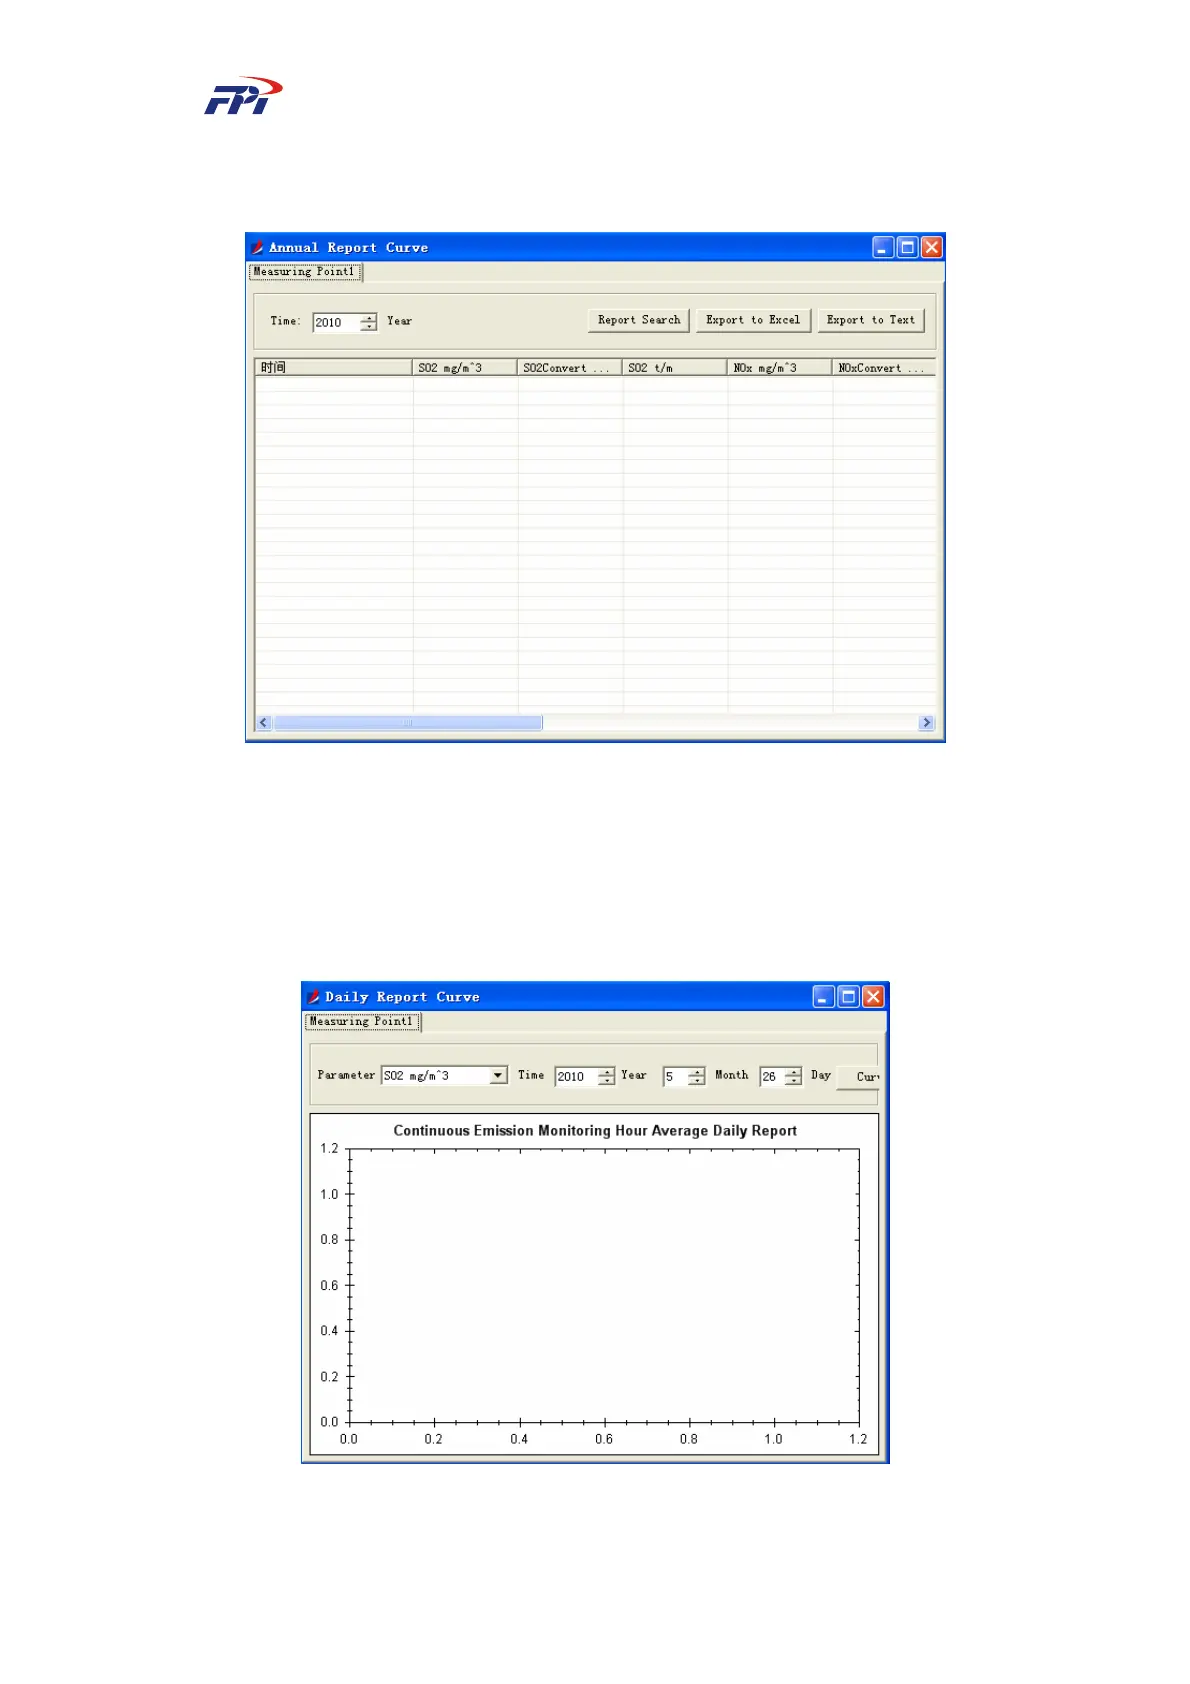
select the year to search the corresponding data as shown in Fig 7-62. The operations can be
referred to 5.4.1.1 Daily Report.
Fig 7-62 Annual Report
7.4.2 Graphic Report
7.4.2.1 Daily Report Curve
The daily report curve displays the curve based on the hourly data, as shown in Fig 7-63.
Fig 7-63 Daily Report Curve