7. FISH FINDER (SOUNDER)
7-5
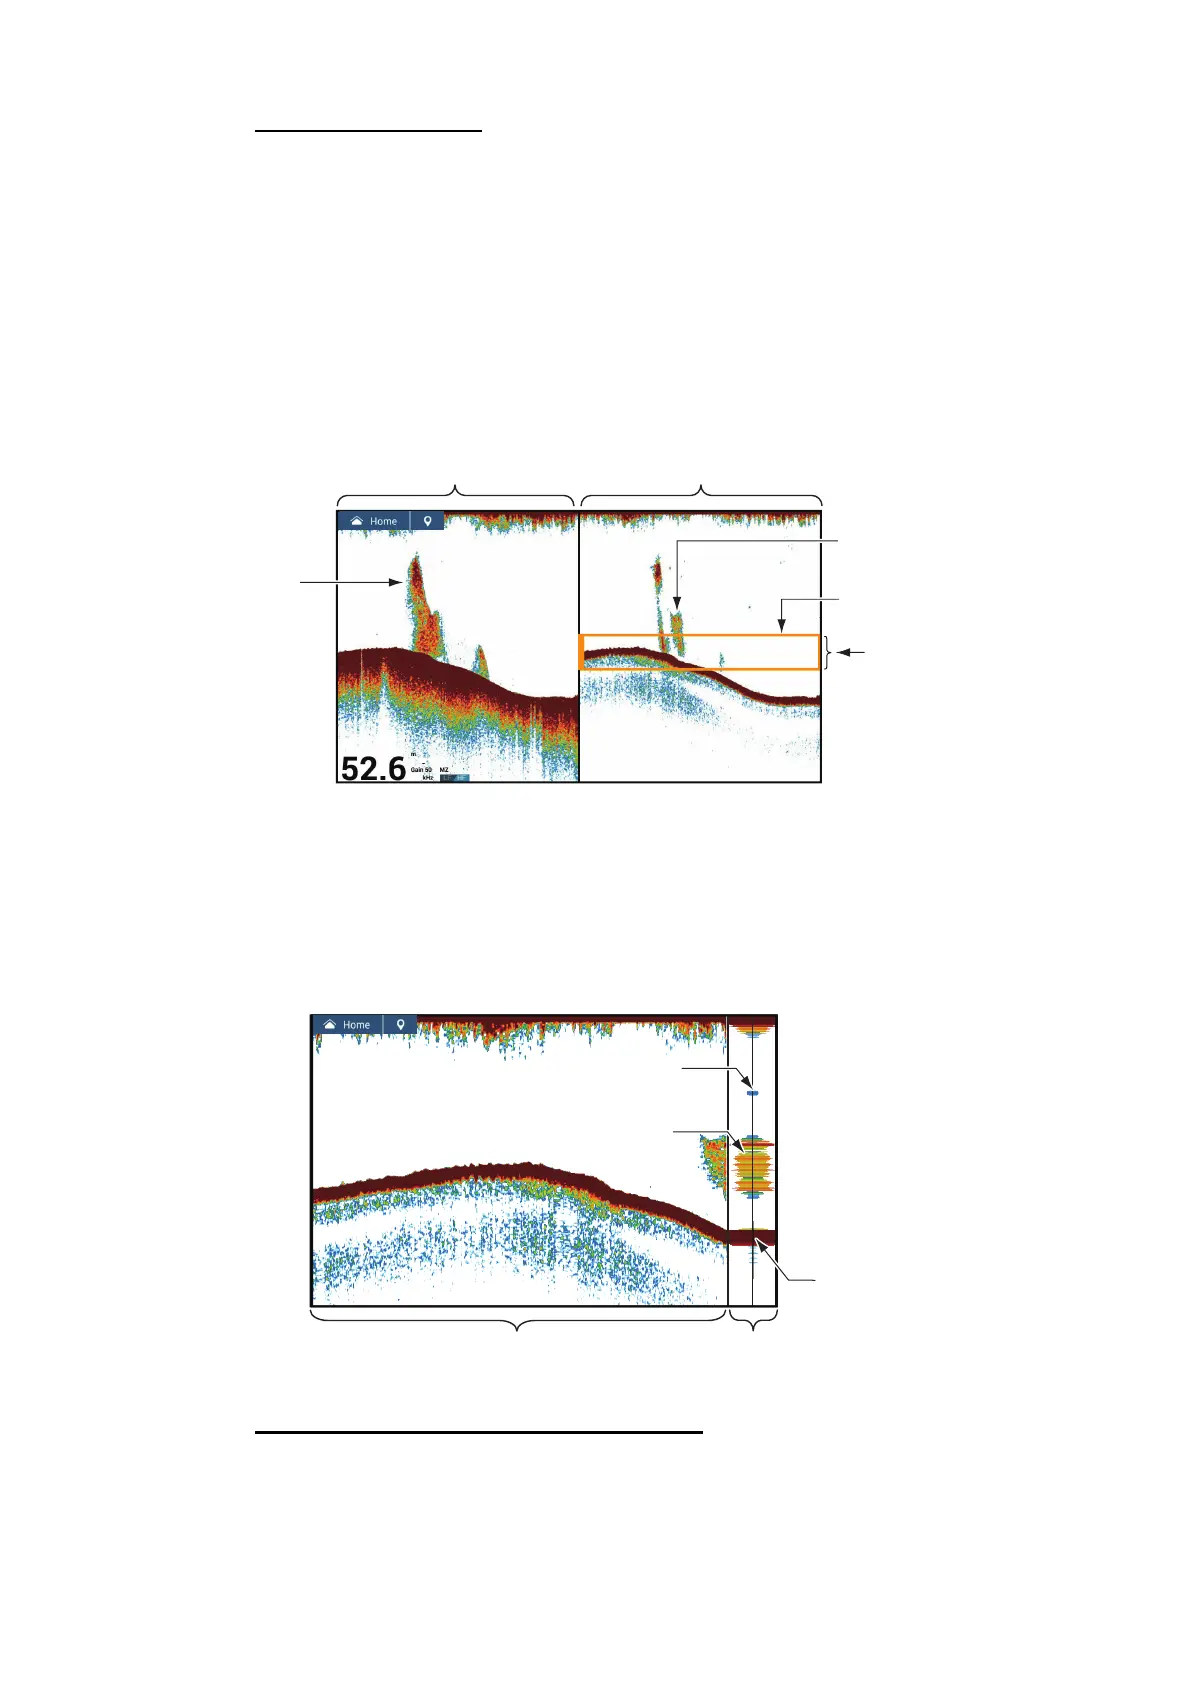
Marker zoom display
The single frequency picture is shown on the right half of the screen, and the area sur-
rounded by the yellow enlargement marker on the right-half of the screen is enlarged
on the left half. This display is useful for determining the size of a school of fish in the
middle layer.
To change the range of the zoom marker, pinch on the screen, operate the slider bar,
or use the menu item [Bottom Lock Range Span], in the [Fish Finder] menu. To shift
the zoom marker (see section 7.4), drag it up or down on the screen, or use [Marker
Zoom Shift] from the [Fish Finder] menu to set the start position (top of marker) of the
zoom marker.
7.3.4 A-scope display (display only)
The A-scope display appears at the right of the screen and is available in any fish find-
er mode. This display shows the echoes at each transmission with the amplitudes and
tone in balance with their intensities. This display helps you identify possible fish spe-
cies and bottom structure.
How to show or hide the A-scope display
Tap the screen to show the pop-up menu, then turn [A-Scope] on or off.
Marker zoom display
Zoomed
school of fish
This part is
enlarged on the left
half of the screen.
Single frequency display
Zoom marker
(orange)
School of fish
200
15.3 °C
A-scope
display
Single frequency display
Strong
reflection
(bottom)
Fish
echo
Fish
echo
20.5
Weak reflection
(small fish or noise)
m
Gain 50
200 kHz
15.3 °C
 Loading...