Analyzing Runs
69 G-TECH / Pro Competition User Guide, Release 3.1 69
Run Viewing Menu
Menu Item Graph Provides Useful For... Go to...
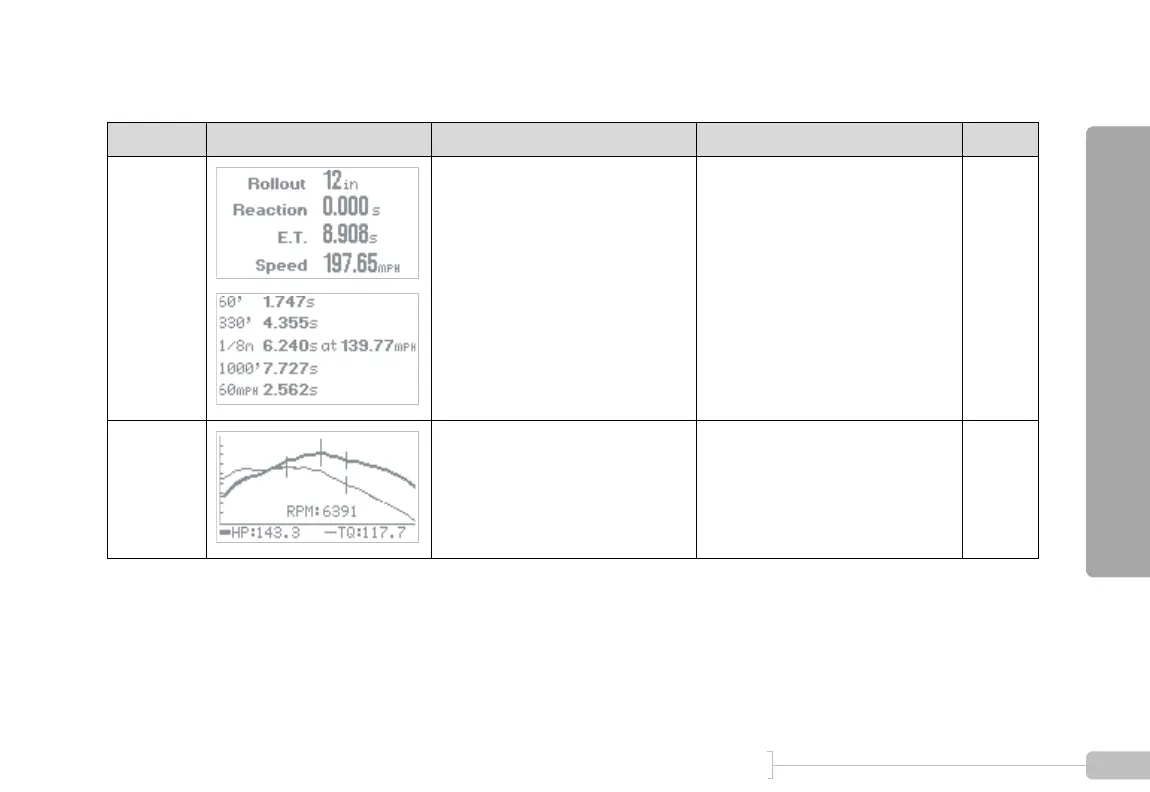
Results 60 ft. time, 330 ft. time, 0-60 MPH
time, 1/8 mile E.T. and trap speed,
1000 ft. time, 1/4 mile E.T. and trap
speed
• Measuring vehicle’s straight line
performance
p. 72
HP & TQ
vs RPM
Graph of Horsepower & Torque
curves for a particular gear and
RPM range
• Getting a “dyno plot” of your
vehicle
• Determining the best shift point
p. 72