Analyzing Runs
87 G-TECH / Pro Competition User Guide, Release 3.1 87
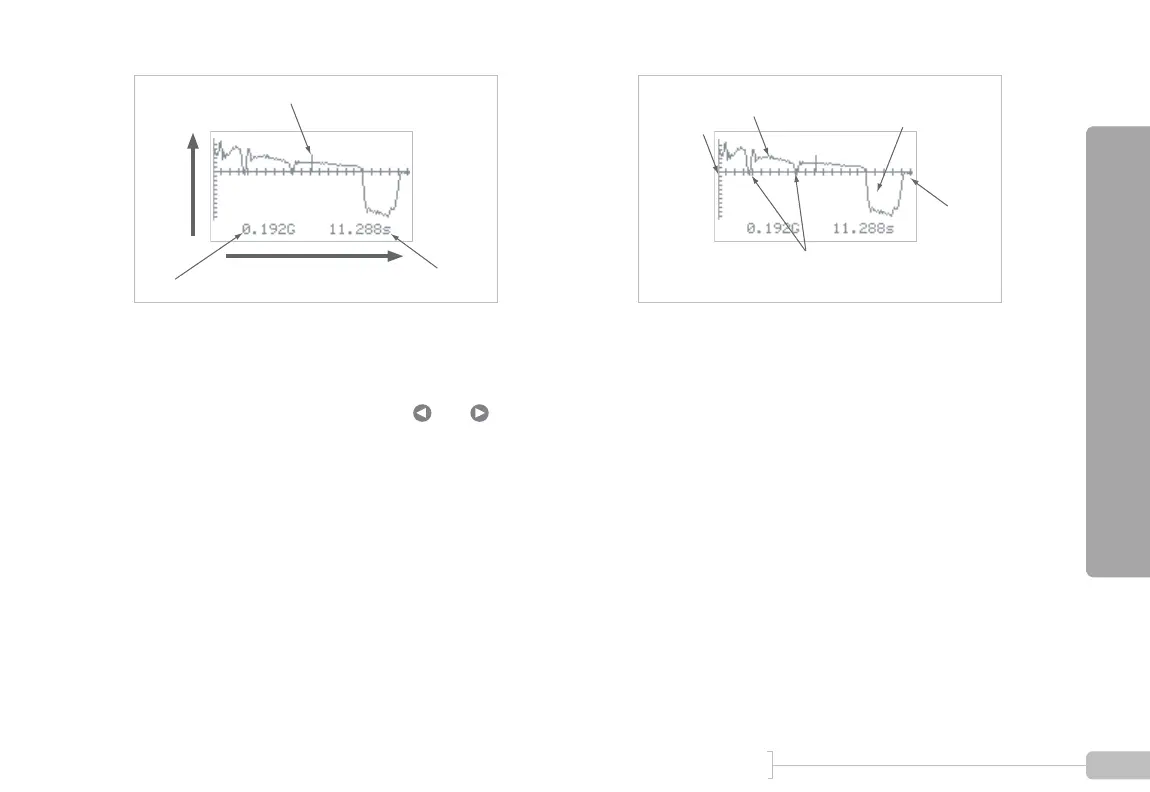
Figure 40: Graph of Gs vs time
Some things to note about this graph:
• As with other graphs, you can use and to move
the cursor. The G-reading and timestamp always reflect
their respective readings at the current cursor position.
• Each tic mark on the horizontal axis marks 1 second
• Each tic mark on the vertical axis marks 0.1G of acceler-
ation
Figure 41 highlights some other useful information on the
graph.
Figure 41: Braking and accelerating
• When the G plot is above the horizontal axis, it means
the vehicle is accelerating.
• When the G plot is below the horizontal axis, it means
the vehicle is decelerating (e.g. coasting, braking).
• The brief dips you see in the graph are shift points.
When you shift, you temporarily remove power, and
this causes the vehicle to decelerate briefly, until you re-
engage the next gear.
• In a very powerful vehicle, or a traction-limited vehicle,
you may also spot dips in acceleration that are not due
to shifts.
Accelertation(Gs)
Time
Forward Gs at cursor
Time at cursor
Cursor
Shifts
(Gs drop)
Vehicle
stopped
(0Gs)
Accelerating
(Positive Gs)
Braking
(Negative Gs)
0Gs