6.2 Advanced Color Map
The Advanced Color Map display shows fifty sets of data in a 2-dimensional plot using
colors to indicate the amplitude of the data. This is typically used to analyze a series of
profile arrays from scanning sensors; although this can be used to plot any array data in
the database. The normal use for this display is with an End of Scan measurement array:
each row then represents one scan and each column the measurement over time at a fixed
scan position.
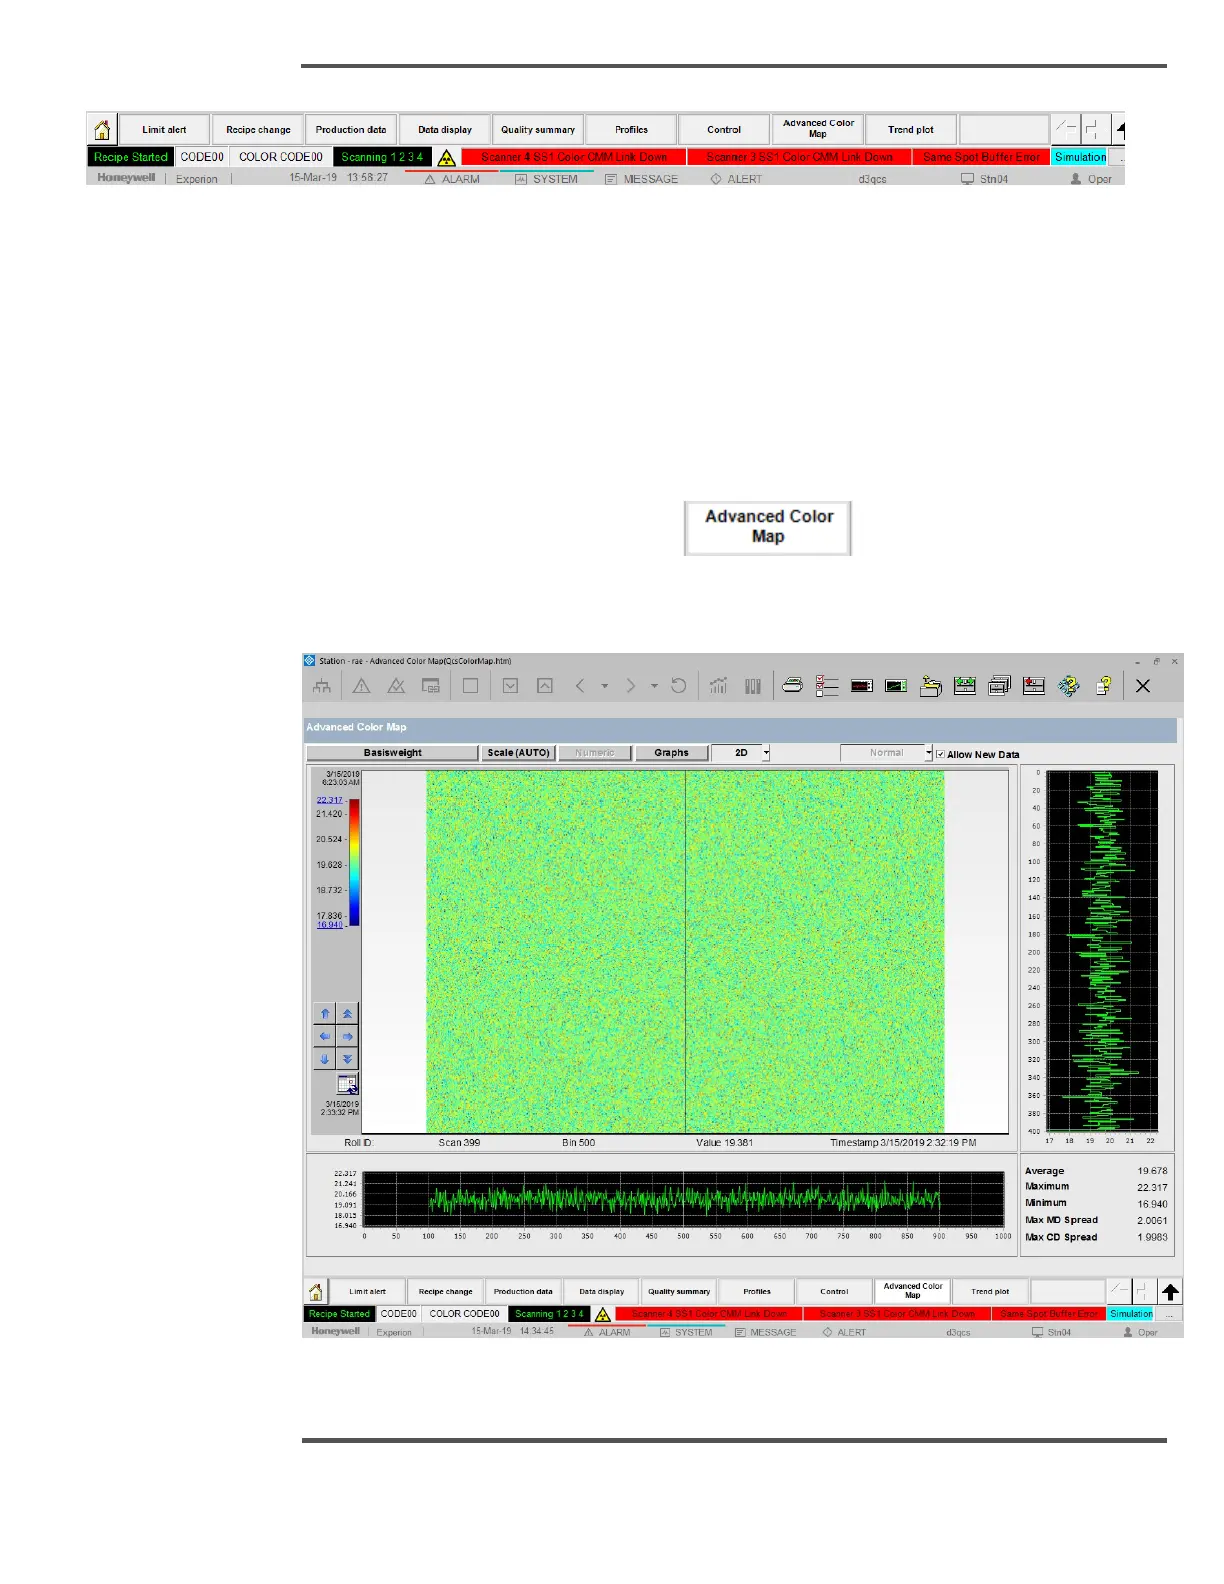
When you click the Advanced Color Map button on the navigation bar,
following screen is displayed.
Fig. 89. 2D - Advanced Color Map

 Loading...