6.6 Profile Display
Fig. 103. Profile Display Button
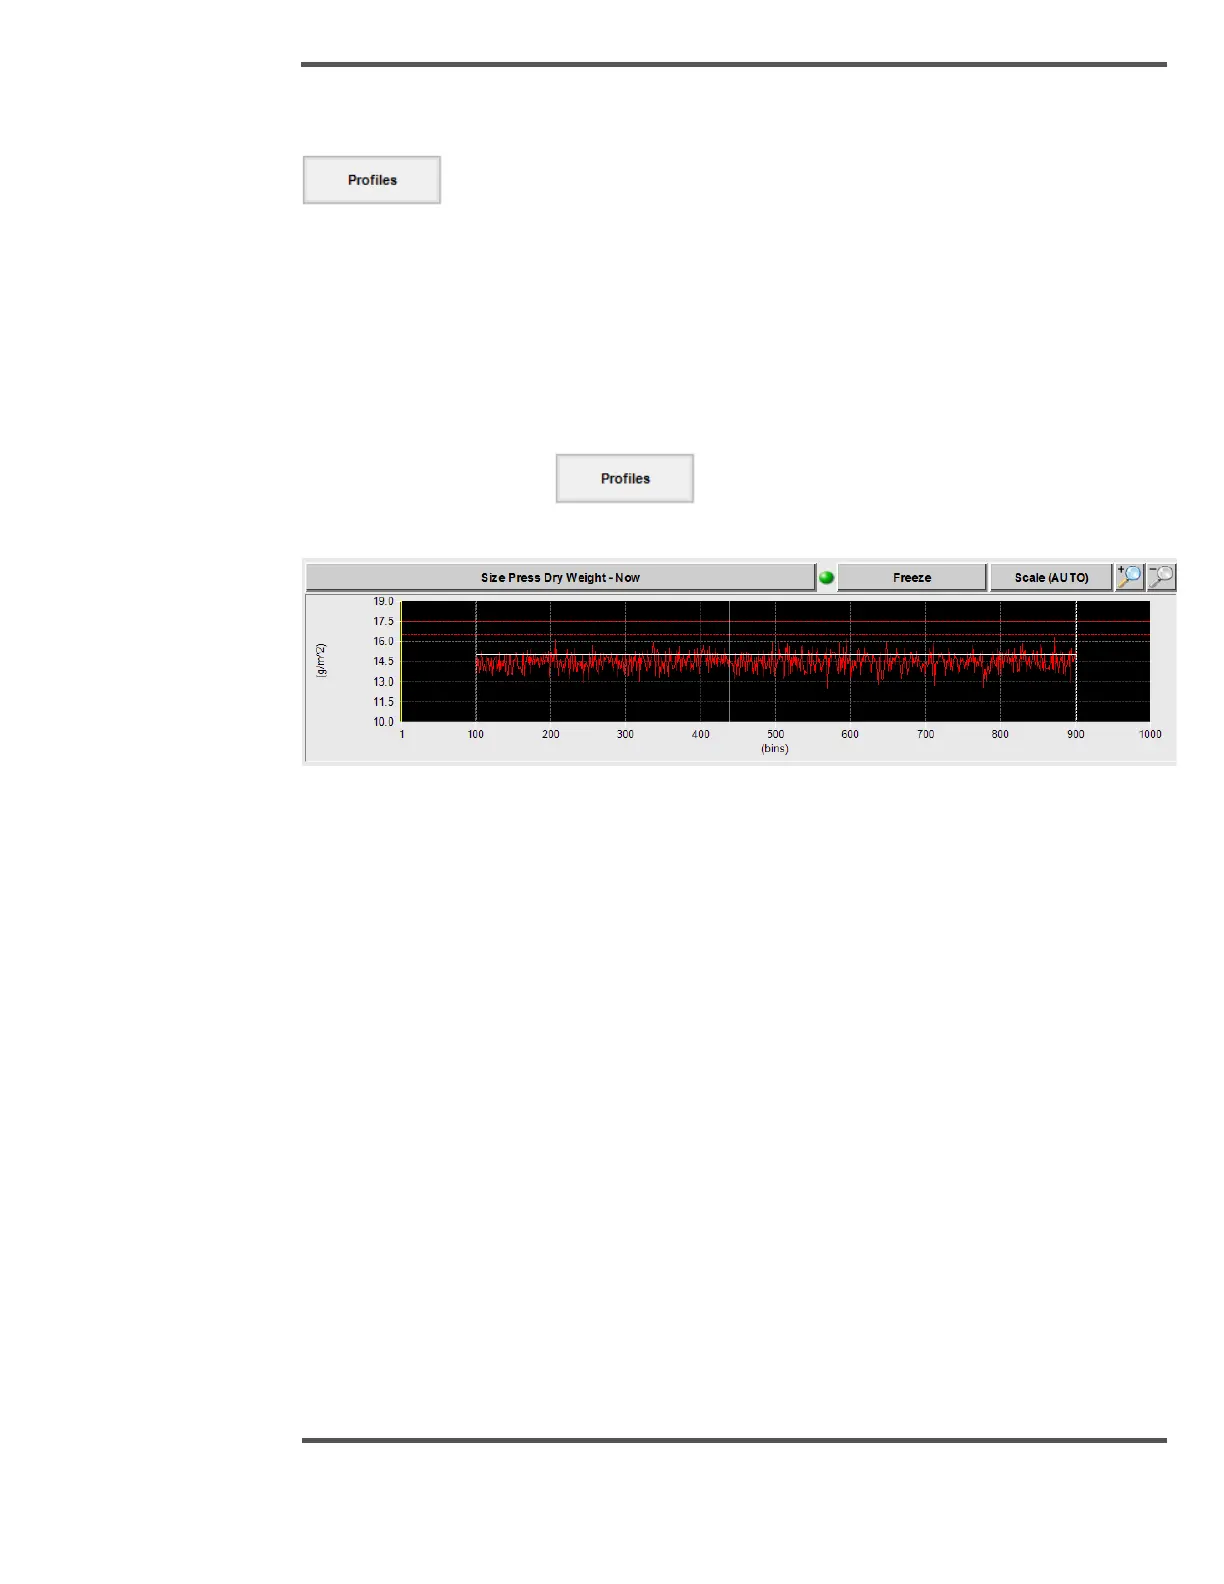
The Profile display shows up to three profiles of the primary scanning parameters on one
display. Each profile shows the CD variations for the selected variable. The vertical axis
represents the value of the variable being measured or monitored. The RED horizontal
lines on the graph are the LIMITS set in the recipe (Refer to Figure 104). The horizontal
axis can be selected to display the cross-direction position in a variety of measurement
units; for example, millimeters, inches, or bins.
When you click the Profiles button on the navigation bar, following screen
is displayed.
Fig. 104. LIMITS Set in the Recipe
 Loading...