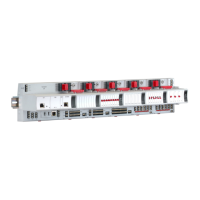
Using the Set selection drop-down, you can select a set, which is shown in the display. A
set describes the collection of three fixed point profiles that are brought up on the display
when a set is selected from the combo box list.
Fig. 146. Set Selection drop-down
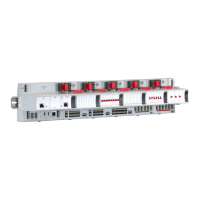
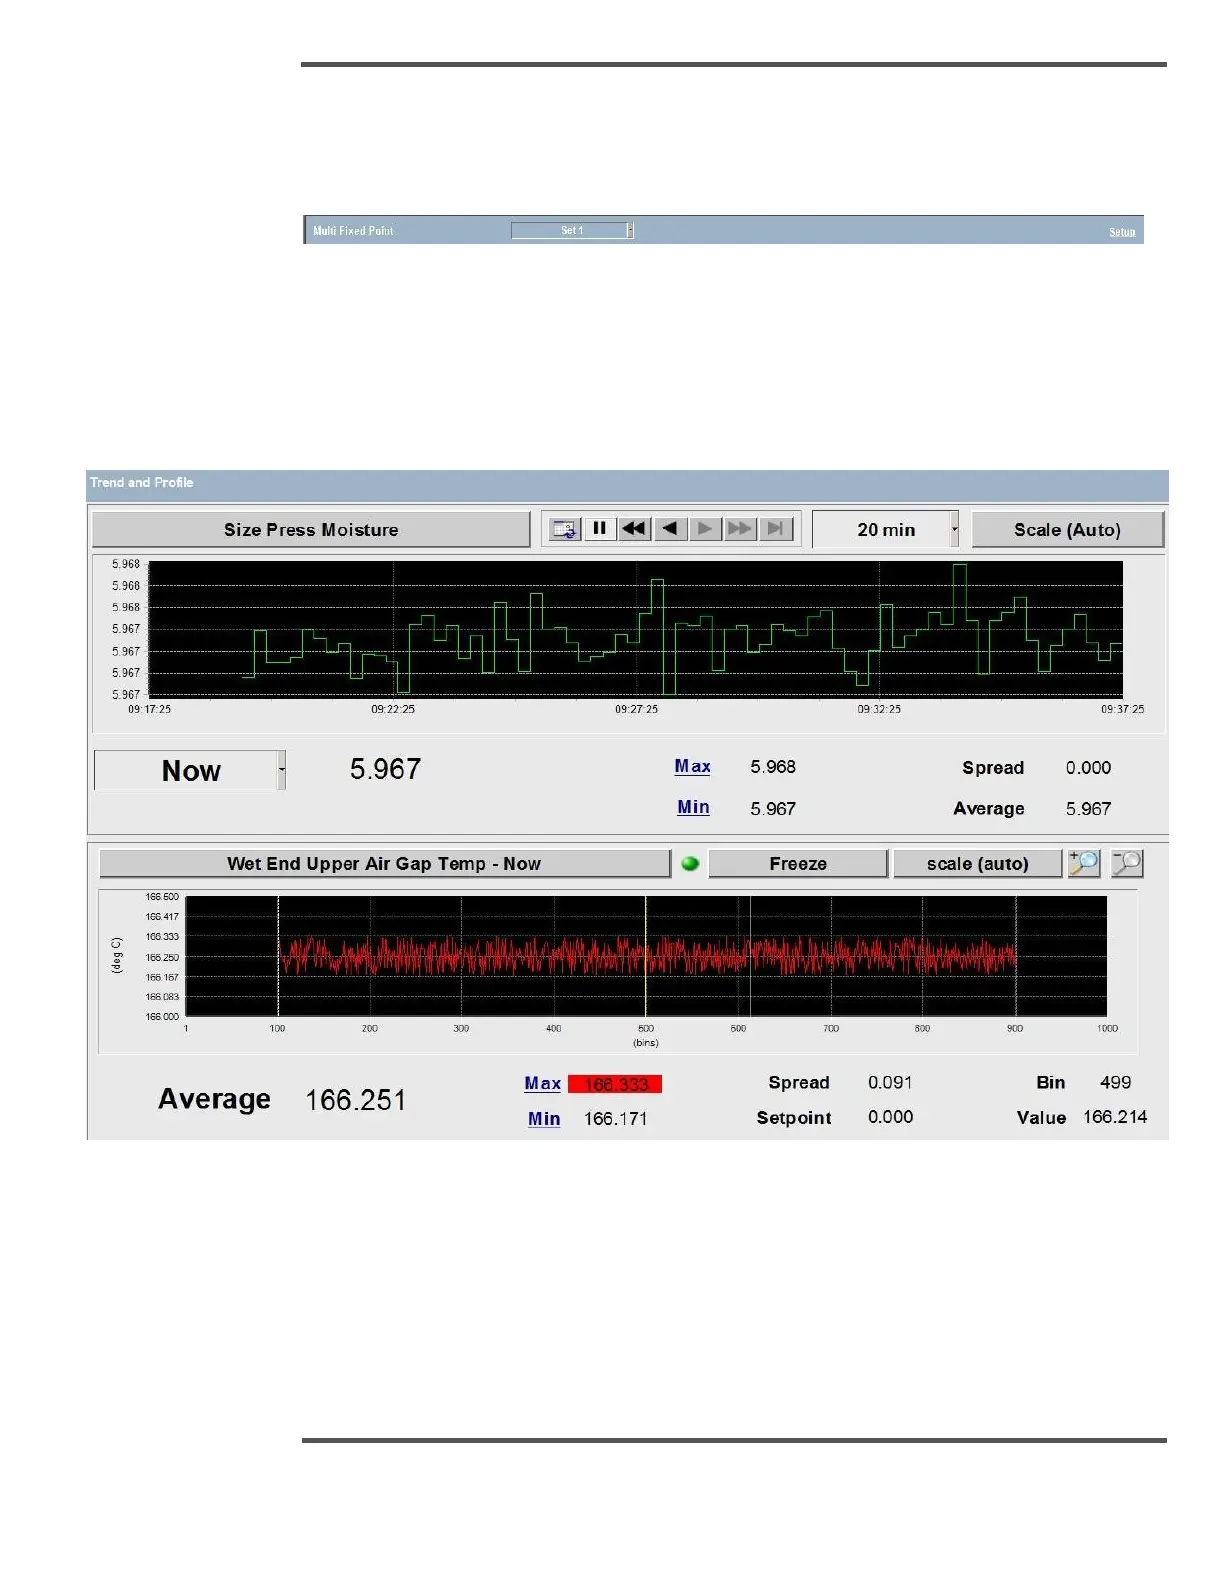
6.13 Trend and Fixed Point
The Trend and Fixed Point display combines a single standard Trend plot graph with a
single Fixed Point graph.
Fig. 147. Trend and Profile Display
This Display is divided into
• Trend graph
• Fixed Point graph
Trend graph: It enables the user to view trend data of a Measurement with defined scaling
and timeframe
 Loading...