PROCESS INFORMATION DISPLAYS
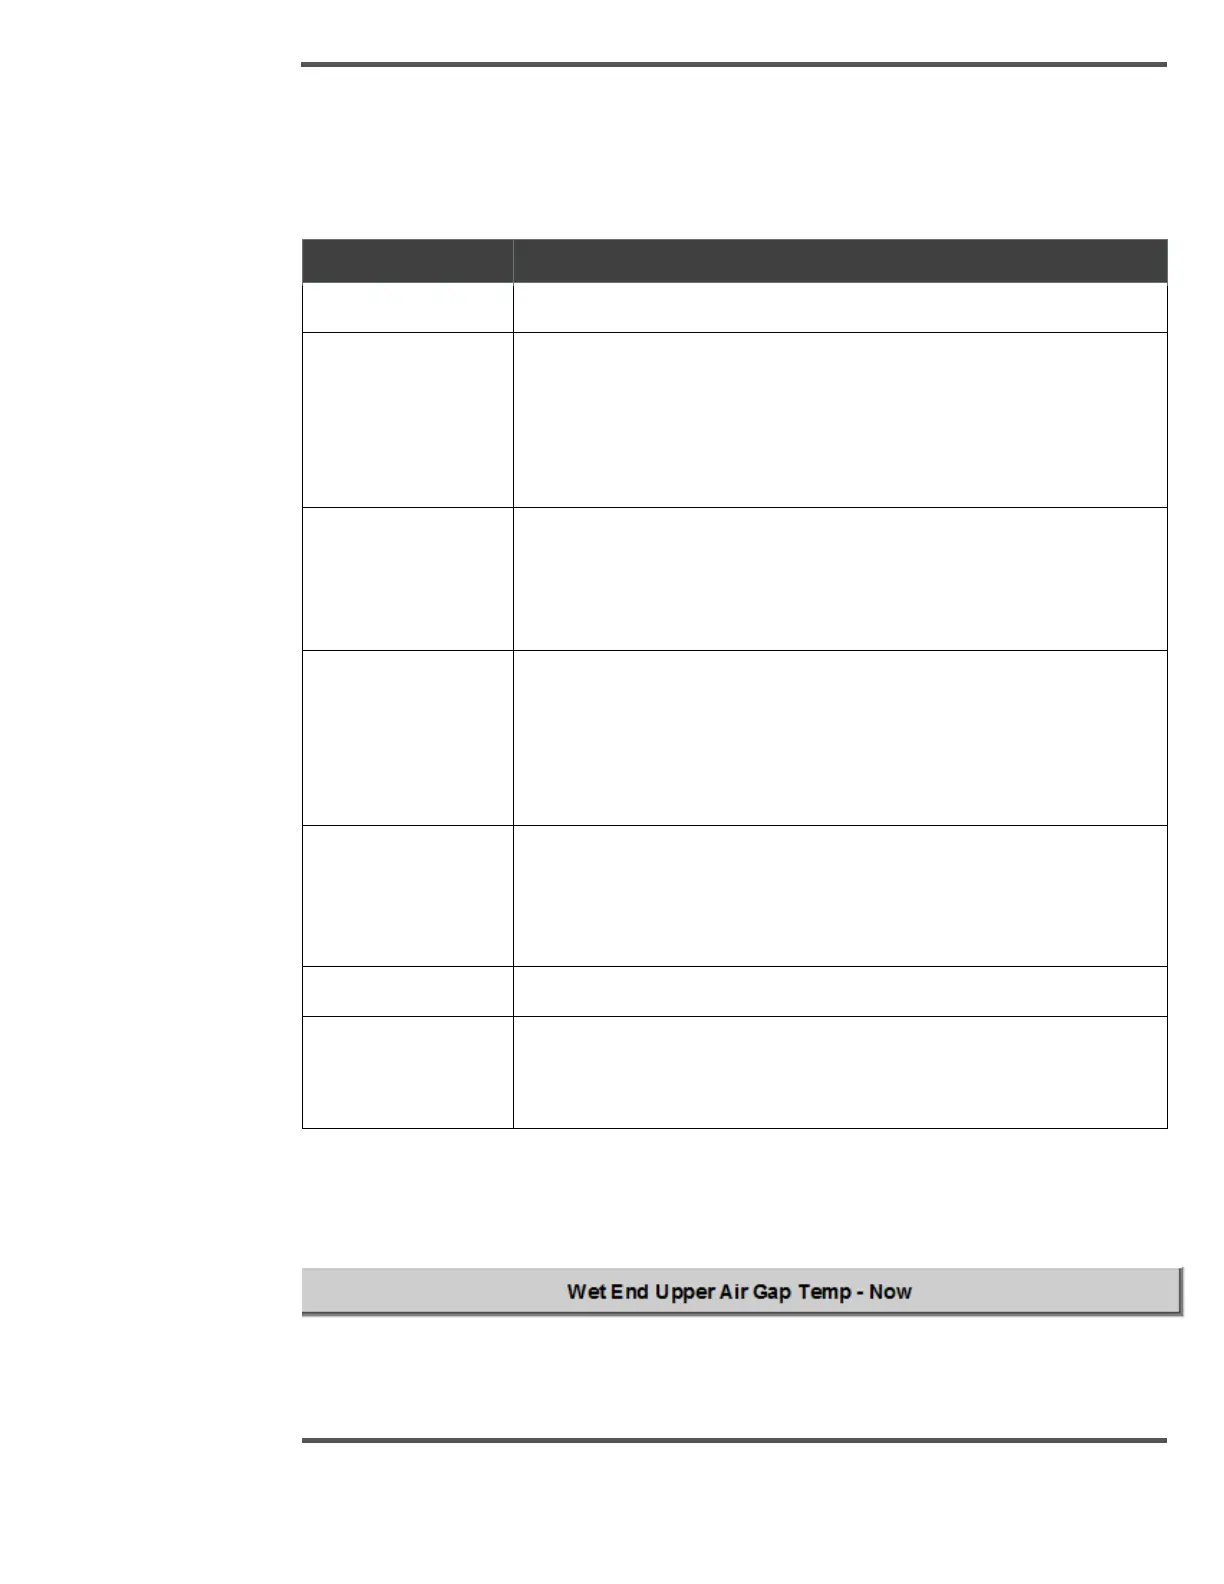
Data Section Description:
Below table describes each field in the data section.
Bin Number indicates to the where the cursor is pointing.
Max is the maximum value of the data for the displayed variable,
including the data not shown when zoomed in. If this maximum value
exceeds the limit, it is displayed in red on black. If the variable is
displayed around setpoint or average, the value displayed is the
maximum, minus the setpoint or average respectively.
Average is the average value of the data for the displayed variable, this
includes the data not shown when zoomed in. If the variable is being
displayed around average, a green arrow is shown to the right of the
label.
Min is the minimum value of the data for the displayed variable,
including the data not shown when zoomed in. If this minimum value
exceeds the limit, it is displayed in red on black digits. If the variable is
being displayed around setpoint or average, the value being displayed
is the setpoint or average, minus the minimum respectively.
Spread is the n sigma spread of the data for the displayed variable,
including the data not shown when zoomed in. n is the sigma
multiplier as set through the System Setup & Debug pop-up display. n
is typically 2
Range is the difference between the max and min value
Setpoint is the setpoint value for the displayed variable. If the variable
is being displayed around setpoint, a green arrow is shown to the right
of the label.
6.6.1 Profile Selection
When you click the Profile Selection , the profile selection drop-down appears.
Fig. 106. Profile Selection
 Loading...