6.6.6 Cursor
The cursor, provided on each profile, may be used to display the profile value of any point.
Select the cursor by clicking on the vertical yellow line and dragging this line (the cursor) to
any point on the profile. The cursor value box displays the profile value at the cursor
location. A NaN (Not A Number) is displayed if no data is available at the cursor location.
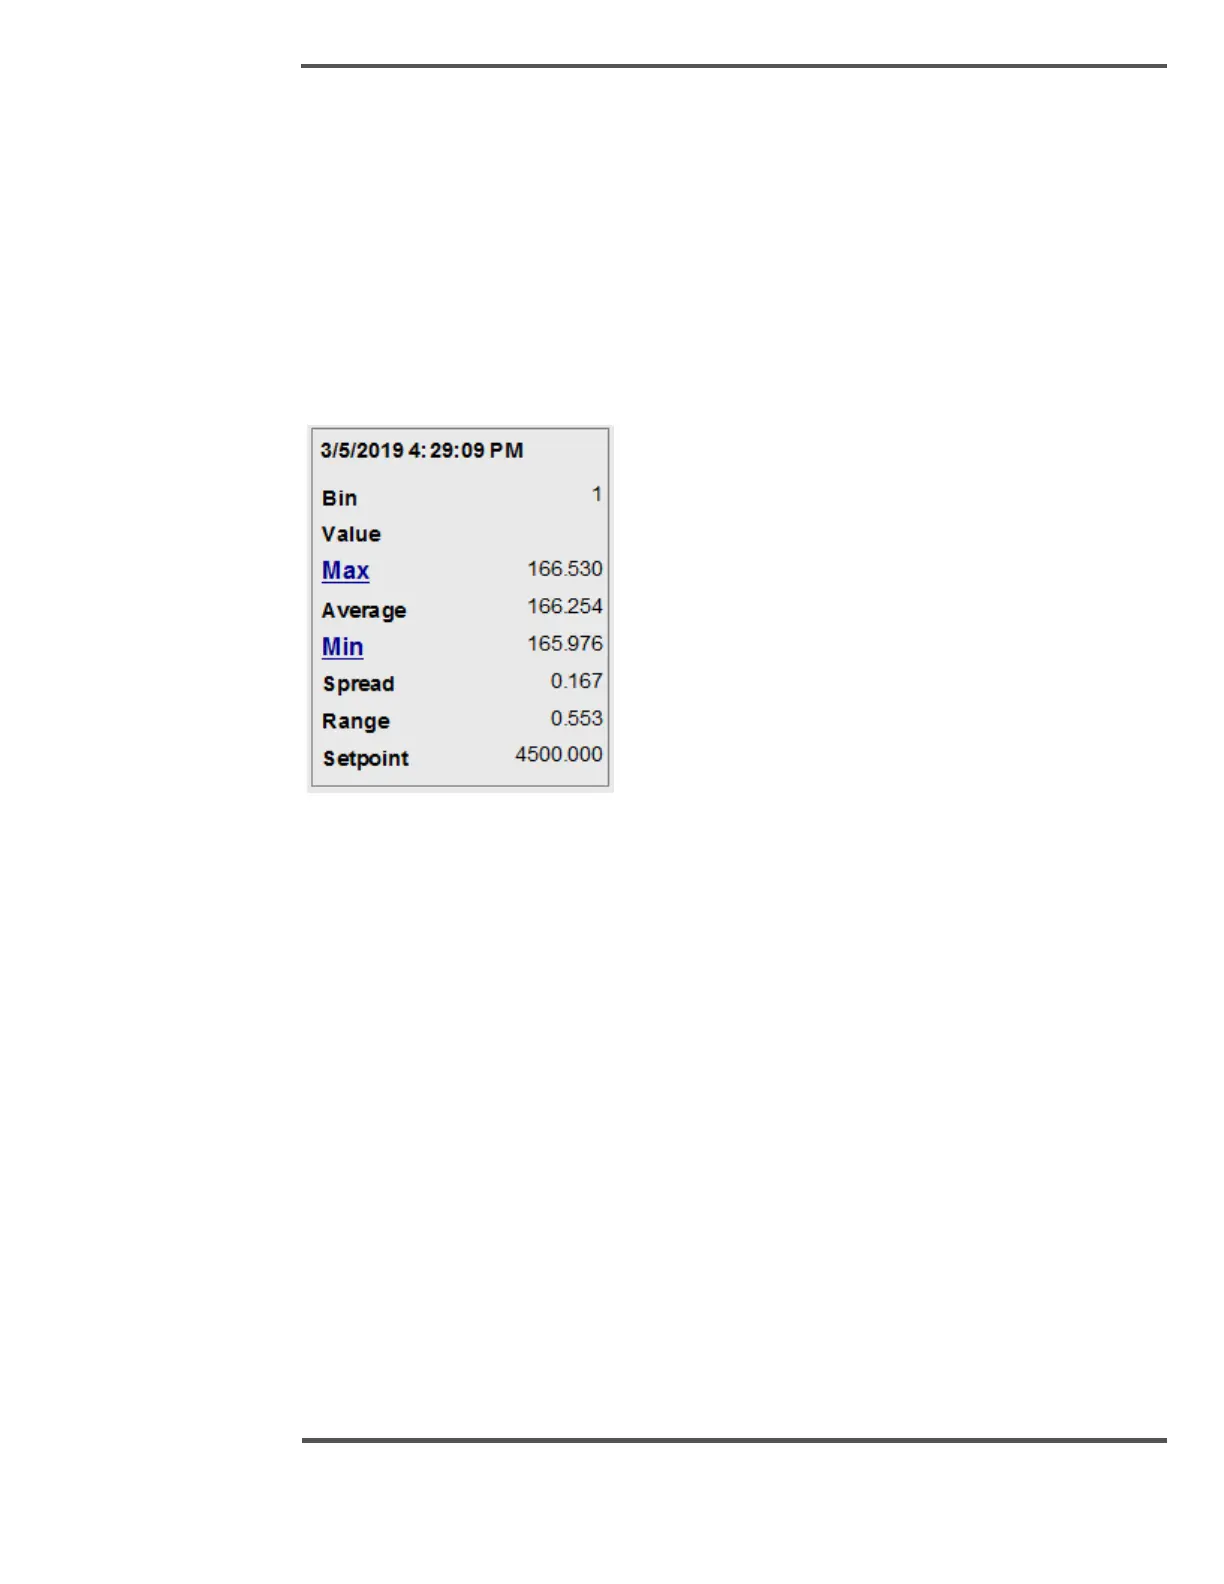
6.6.7 Data Selection
The data section to the right of the graph shows detailed information for the graph.
Fig. 113. Data Selection in Profile Display
The information displayed:
1. The timestamp of the last update to the displayed variable – note that this time
continues to update when the variable’s display is frozen. When the difference
between the current timestamp and the timestamp of the last update of the variable
is greater than the maximum, the data is considered stale and is displayed in red on
black.
2. Max is the maximum value of the data for the displayed variable, including the data
not shown when zoomed in. If this maximum value exceeds the limit, it is displayed in
red on black. If the variable is displayed around setpoint or average, the value
displayed is the maximum, minus the setpoint or average respectively.
3. Setpoint is the setpoint value for the displayed variable. If the variable is being
displayed around setpoint, a green arrow is shown to the right of the label.
4. Min is the minimum value of the data for the displayed variable, including the data
not shown when zoomed in. If this minimum value exceeds the limit, it is displayed in
red on black digits. If the variable is being displayed around setpoint or average, the
value being displayed is the setpoint or average, minus the minimum respectively.
 Loading...