PROCESS INFORMATION DISPLAYS
6.10.1 Profile Selection
There are four profile selection buttons for each profile. When you click on the profile
variable button, a popup dialog box appears, highlighting various variables to choose. The
display is updated with the selected profile and the associated data.
If there is only one production line available, then Production Line
dropdown menu is disabled.
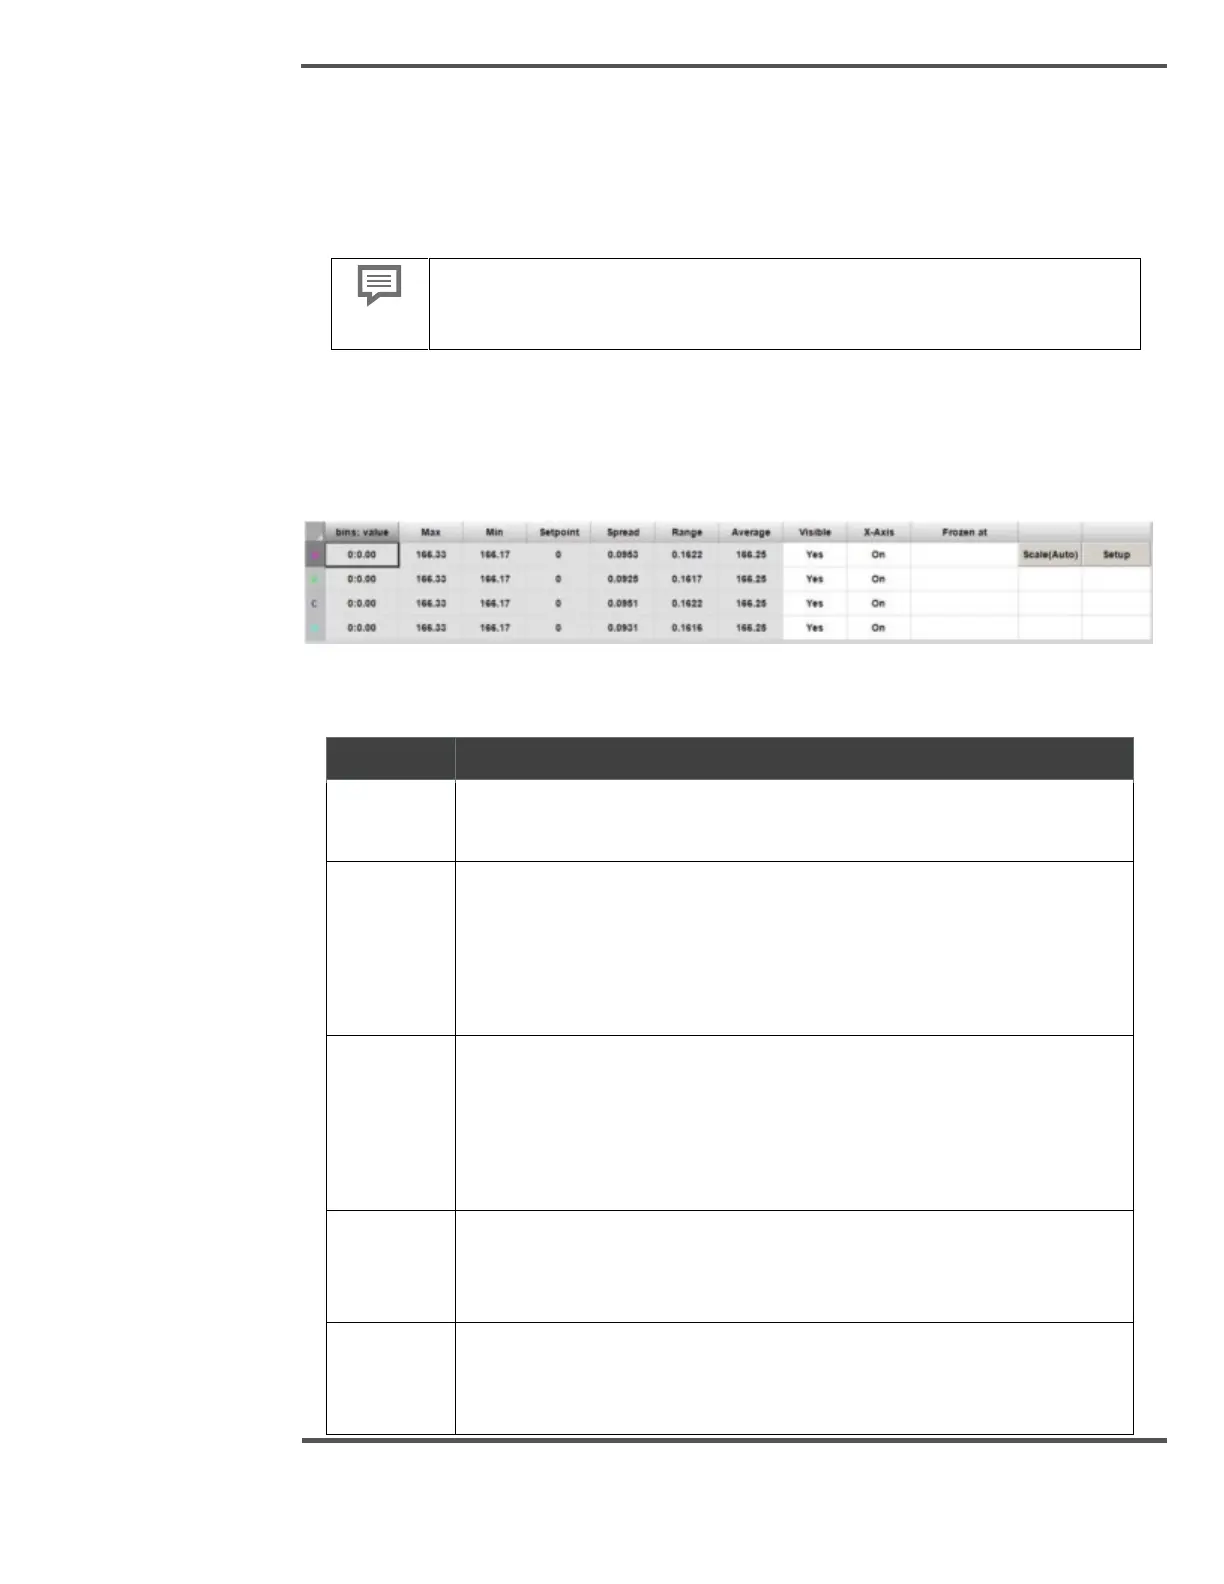
6.10.2 Profile Summary Table
Consists of four rows for four profiles and 11 columns, which contains the detailed
information of each profile.
Fig. 131. Profile Summary Table
Table 11: Profile Summary Table
This column represents the unit position and corresponding value for
each profile.
Is the maximum value of the data for the displayed variable, which
includes the data that is not shown when zoomed in. If this maximum
value exceeds the limit, it is displayed in red on black. If the variable is
displayed around setpoint or average, the value displayed is the
maximum, minus the setpoint or average respectively.
Is the minimum value of the data for the displayed variable, including the
data not shown when zoomed in. If this minimum value exceeds the limit,
it is displayed in red on black digits. If the variable is displayed around
setpoint or average, the value being displayed is the setpoint or average,
minus the minimum respectively.
Setpoint is the setpoint value for the displayed variable. If the variable is
being displayed around setpoint, a green arrow is shown to the right of
the label.
Spread is the n sigma spread of the data for the displayed variable, which
includes the data not shown when zoomed in. n is the sigma multiplier as
set through the System Setup & Debug pop-up display, typically 2.
 Loading...