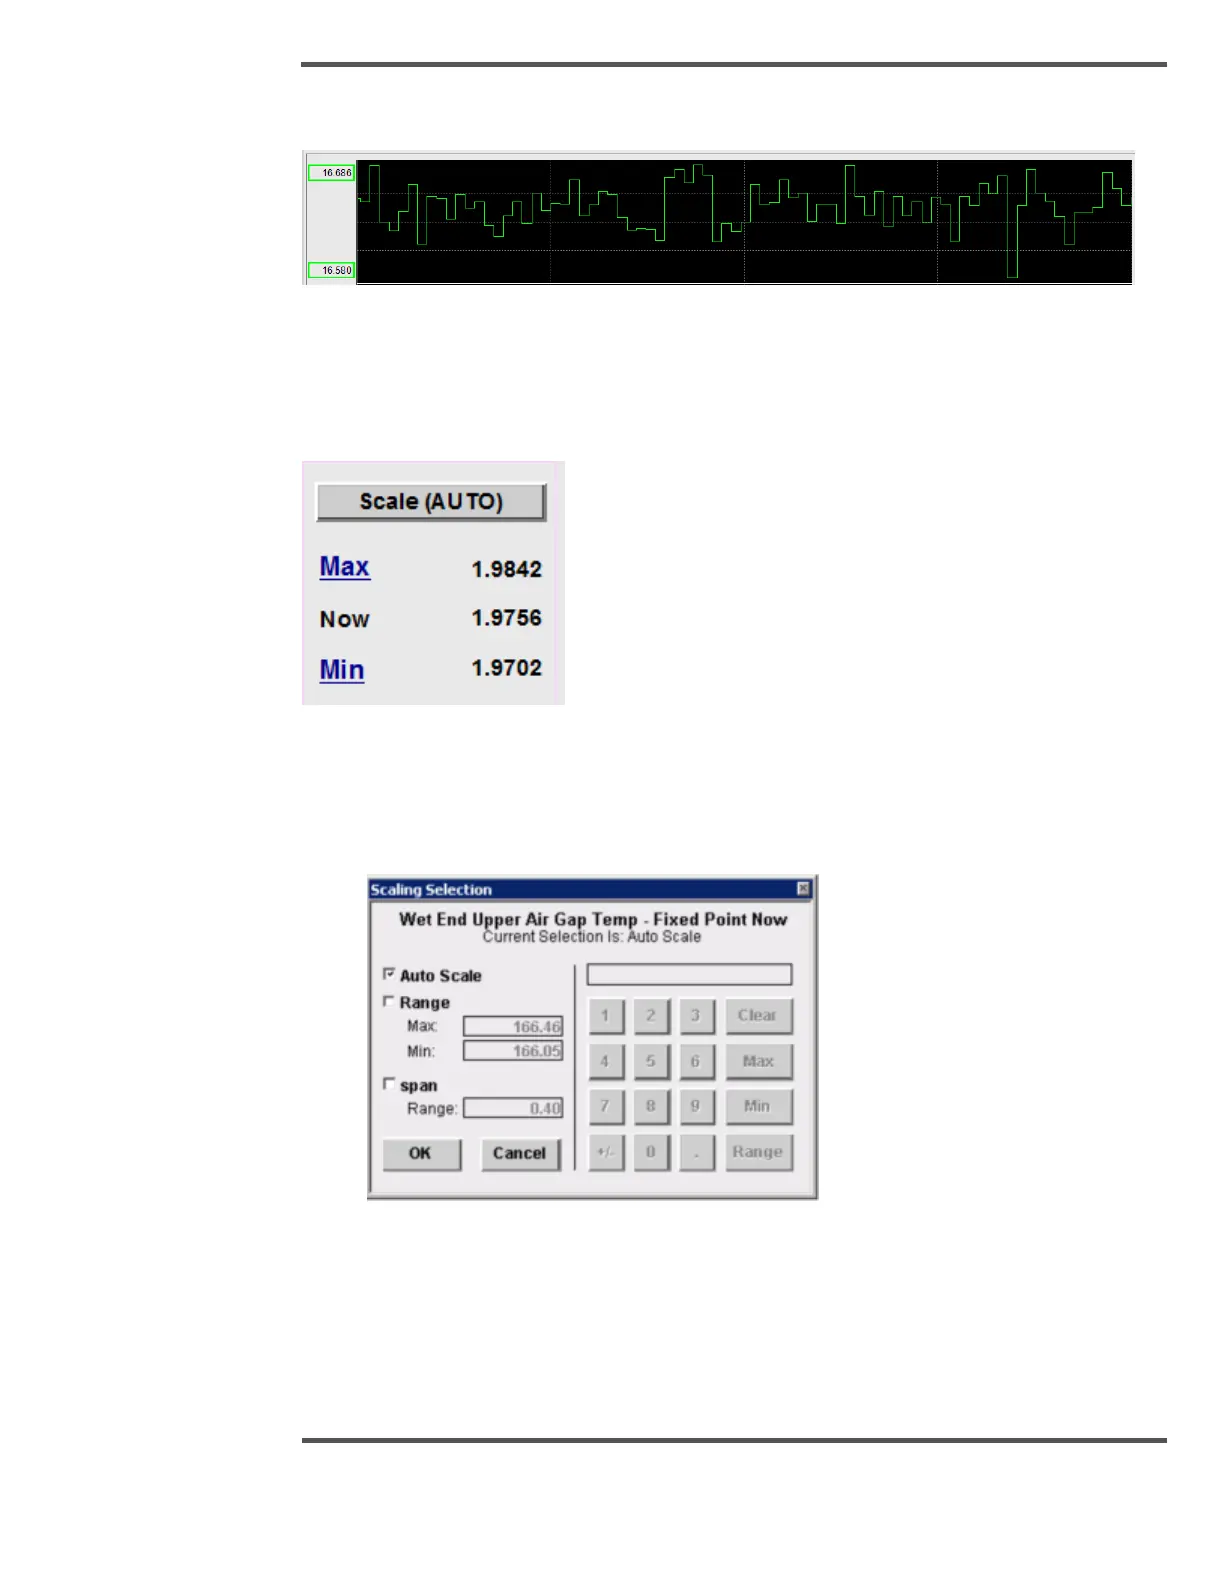
6.8.2 Trend Graph and Data
Fig. 120. Trend Graph and Data
Graph Data and Controls
The Graph Data and Controls show data for graph and allow setting of the graph
parameters.
Fig. 121. Graph Data and Controls
• Scale Button: Use this feature to manually set the trend plot range so that it fits in
the area provided. To activate, click on the button and a pop-up dialog box appears.
• Auto Scale Button: Use this feature to automatically scale the trend plot range so
that it fits in the area provided. To activate, click on the button and the range and
trend on the graph updates.
• Max Button: Use this feature to automatically position the cursor at position with
the maximum value.
 Loading...