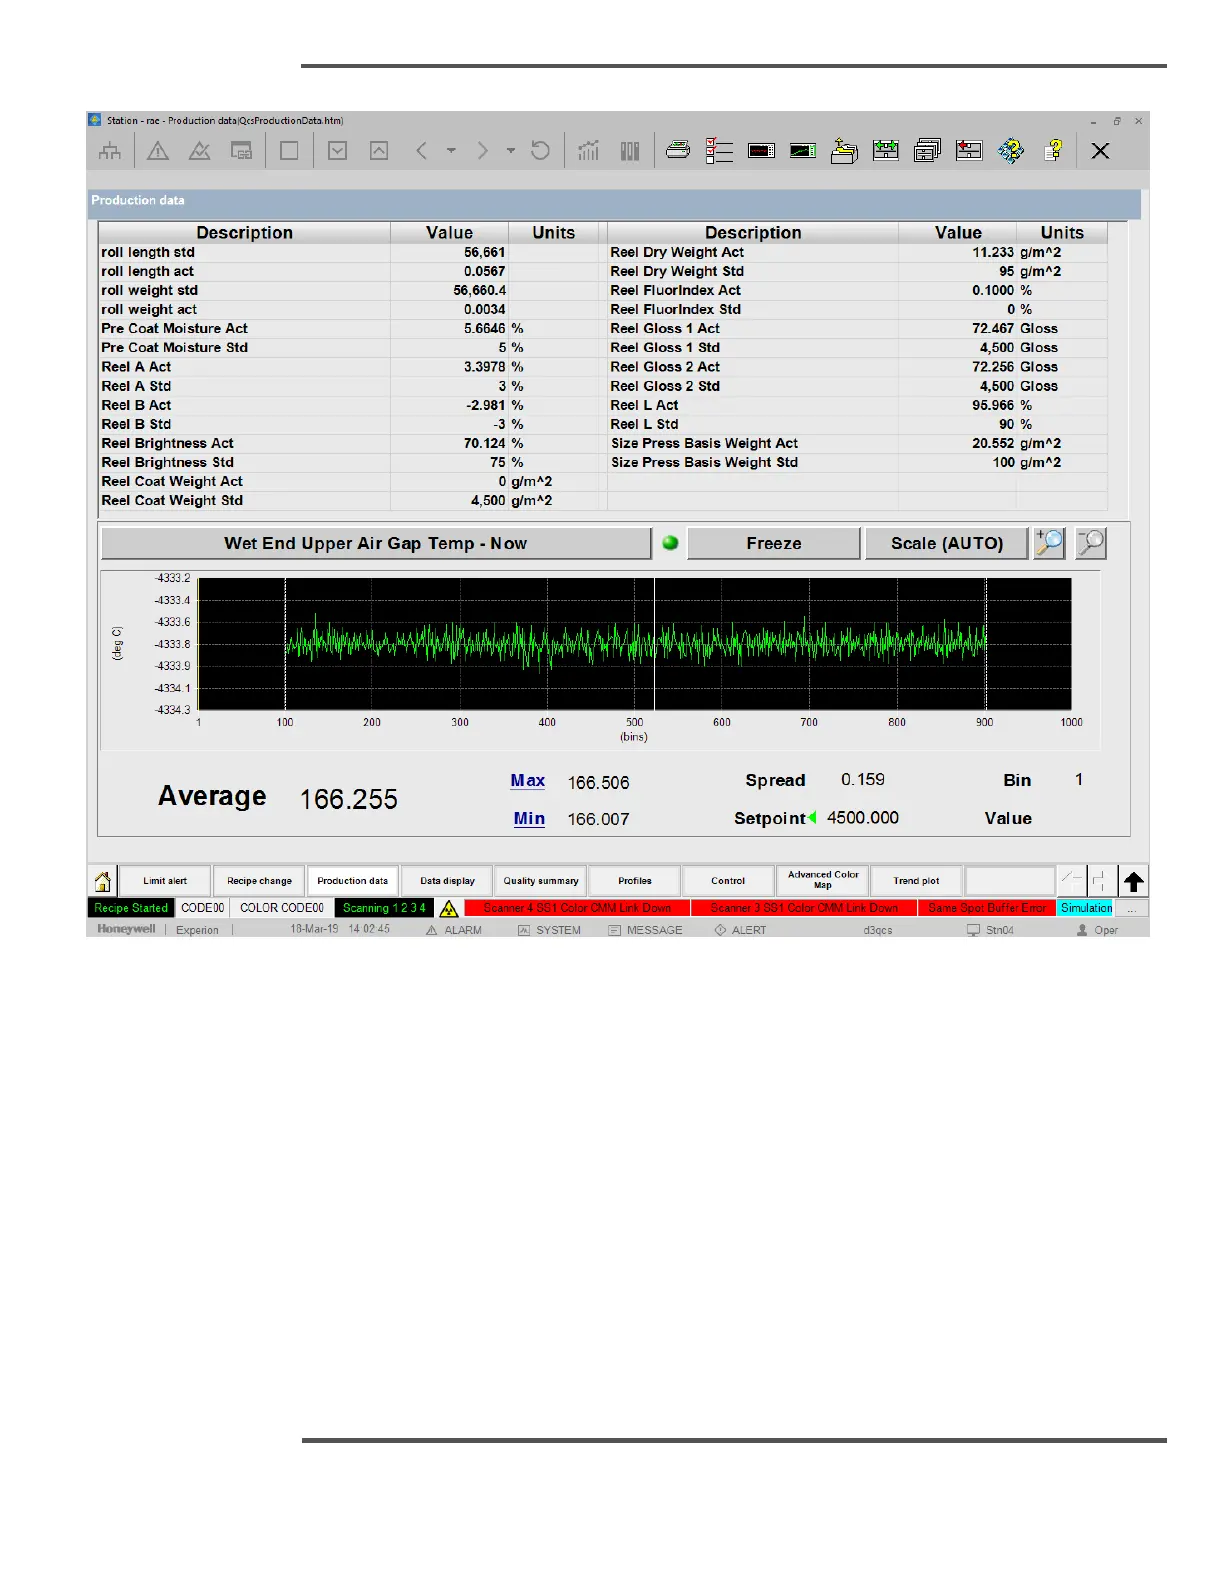
Fig. 102. Production Data Display
The Production Data display is primarily an operator information display. It has two
sections:
• Production Data table (top section): This is a data area for several process
measurements and calculations. This table displays a maximum of 28 production
data values of different measurements into two sections of 14 each, separated by
blank column. In the table the description of measurement, its value, and its units
are displayed. The Values displayed in this table are Read-only.
• Measurement Profile (bottom graph) works in an identical fashion to the Profiles
Display. This displays the CD variations for the selected variable. The vertical axis
represents the value of the variable being measured or monitored. The RED lines on
the graph are the LIMITS set in the recipe. The horizontal axis can be selected to
display the cross-direction position in a variety of measurement units; for example,
millimeters, inches, or bins.
 Loading...