PROCESS INFORMATION DISPLAYS
Click the Sort List check box to sort the measurement list in alphabetical order and vice
versa.
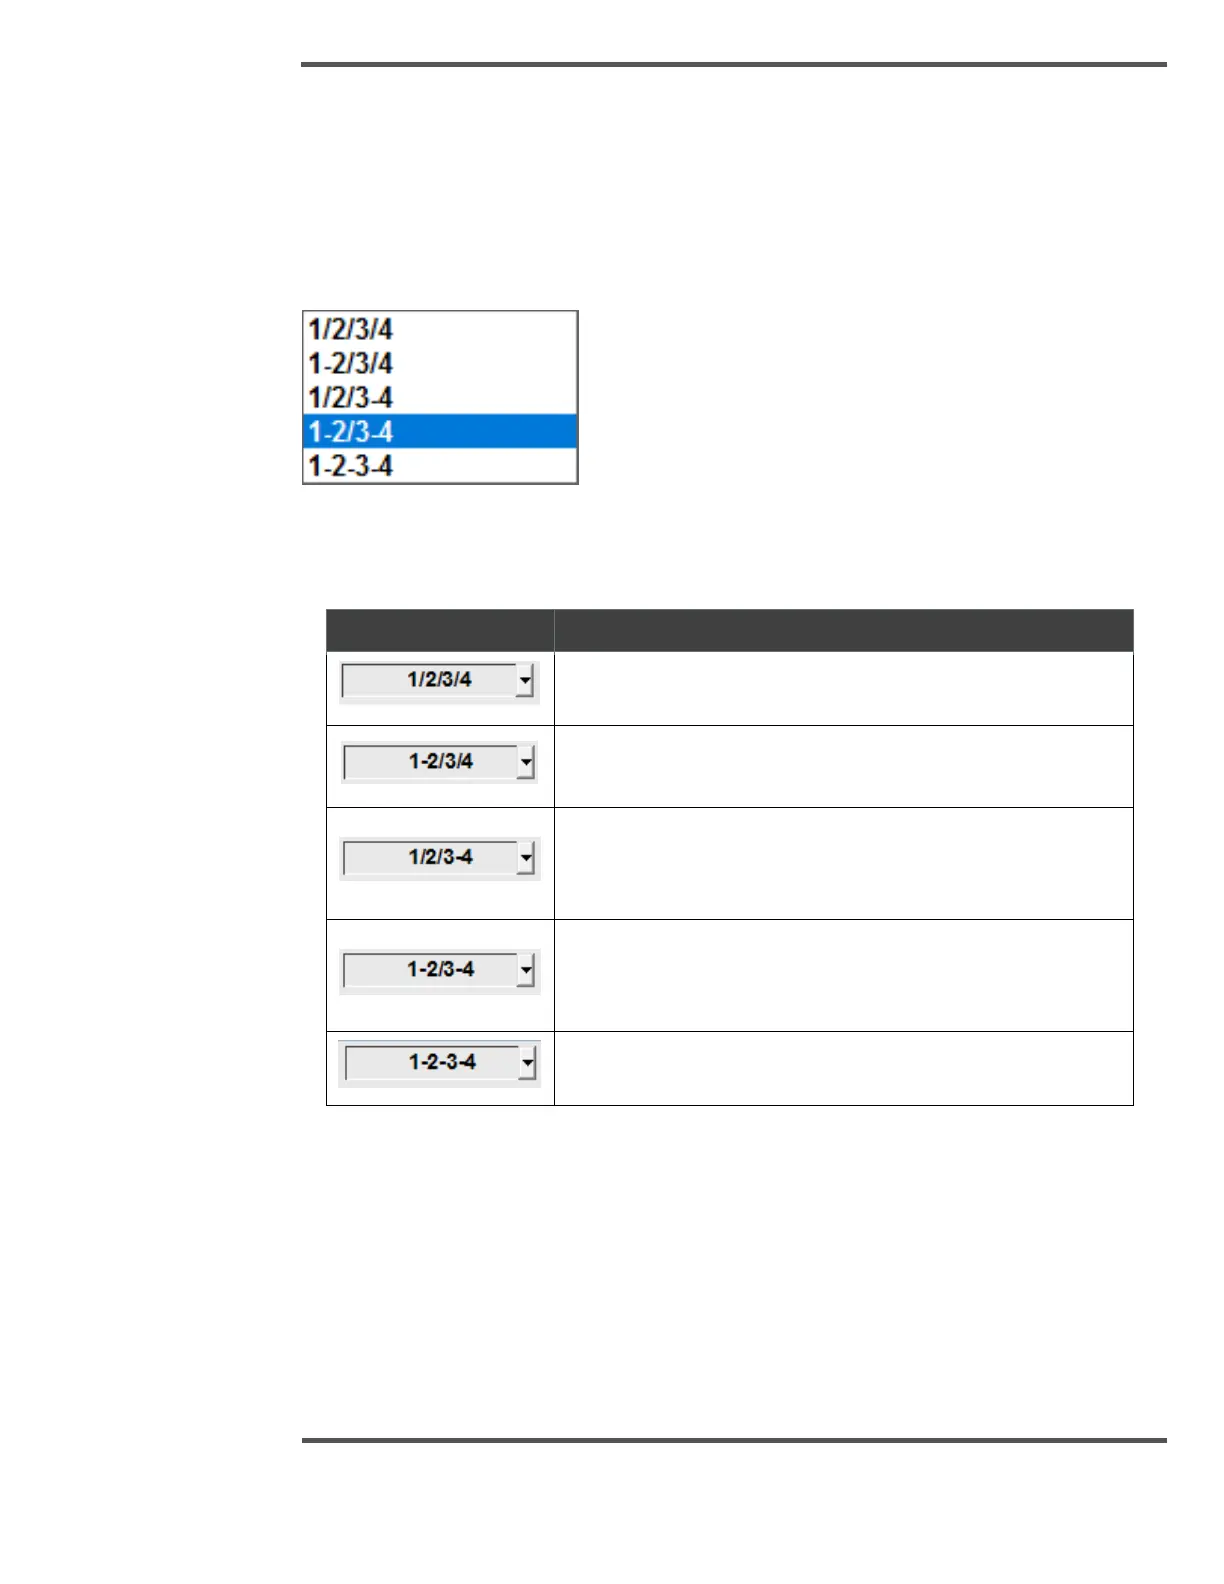
Graph Layout Selector
The Graph Layout Selector controls the how the variables are graphed with respect to each
other.
Fig. 124. Graph Layout Selector
Table 9: Graph Layout Selection Options
The four variables plotted on four individual graphs
The first and second variables plotted together on one graph
and the third and fourth variables plotted on individual graphs
The first and second variables plotted on individual graphs
and the third and fourth variables plotted together on one
graph
The first and second variables plotted together on one graph
and the third and fourth variables plotted together on a
second graph
All four variables plotted together on one graph
Cursor
The cursor selector hides or displays the graph cursor, which shows the value variable at
the cursor position.
 Loading...