2-36 RPL Programming Examples
Program: Comments:
Q!z!
:;<=!
-VFH/!'!
<=4!
From 4.4 to 5 radians, offsets
the label 3 units right and 2
units up.
<=4!
Ends the CASE structure.
qj&GpZ!G!><:!
3!K=4!
#D:K!I{I!'!
Gets the nth value from the
ercentage matrix, rounds it to
one decimal place, and converts
it to a string with “%”
appended.
3!#>KLS!
Converts the string to a
graphics object.
>LK!452!26O:!D:L!
Adds the label to the plot and
stores the new plot.
#EO4!
=<T:!
f!h!2N6<Y!
Displays the updated plot.
Ends the loop structure.
Displays the finished plot.
1!
1!
*u$mZ!D:L7!
1!8!M<=5!
Restores the original flag status.
Restores the previous menu.
(You must first press − to
clear the plot.)
1!
`OPIE K
Stores the program in PIE.
Checksum: # 16631d
Bytes: 737
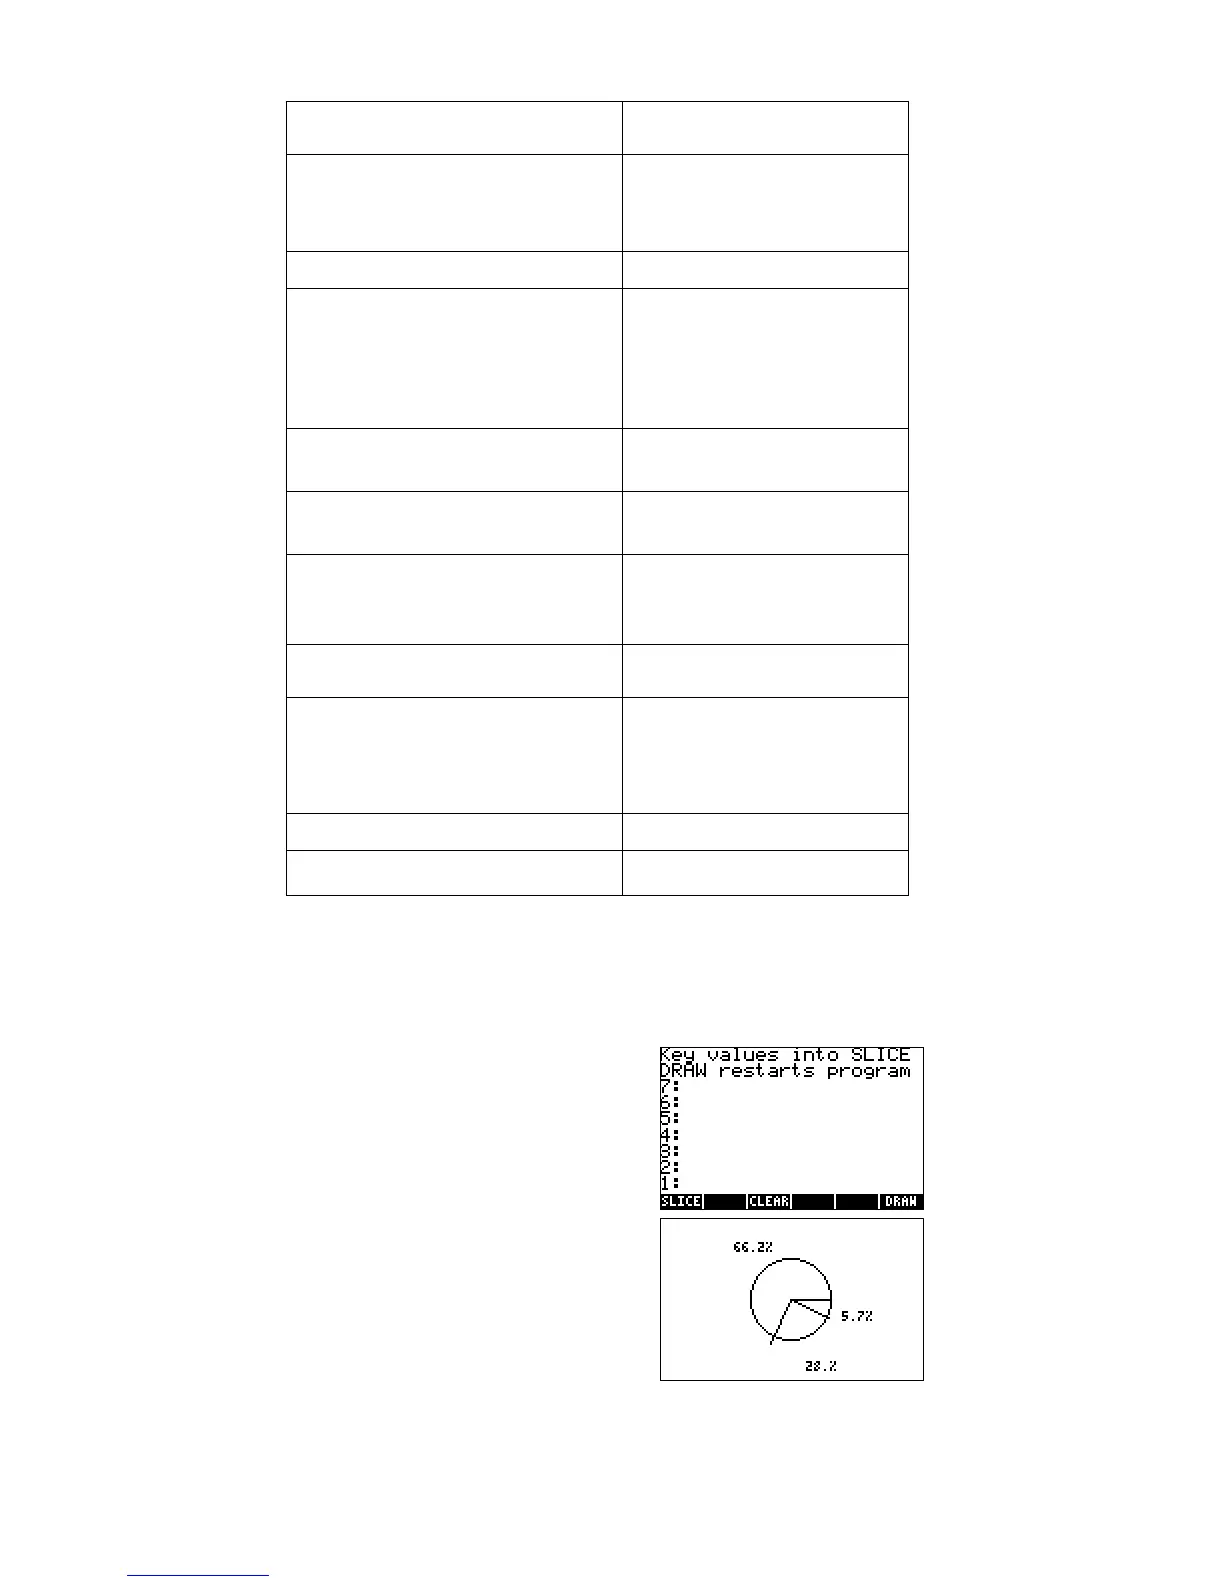
Example: The inventory at Fruit of the Vroom, a drive-in fruit stand, includes 983 oranges, 416 apples, and 85
bananas. Draw a pie chart to show each fruit's percentage of total inventory.
J %PIE%
Clear the current statistics data. (The prompt is removed
from the display.) Key in the new data and draw the pie
chart.
OE<BK
983 %SLICE%
416 %SLICE%
85 %SLICE%
%DRAW%
Press − to return to the stack display.