LX8000 version 0.96 April 2008
Page 27 of 85
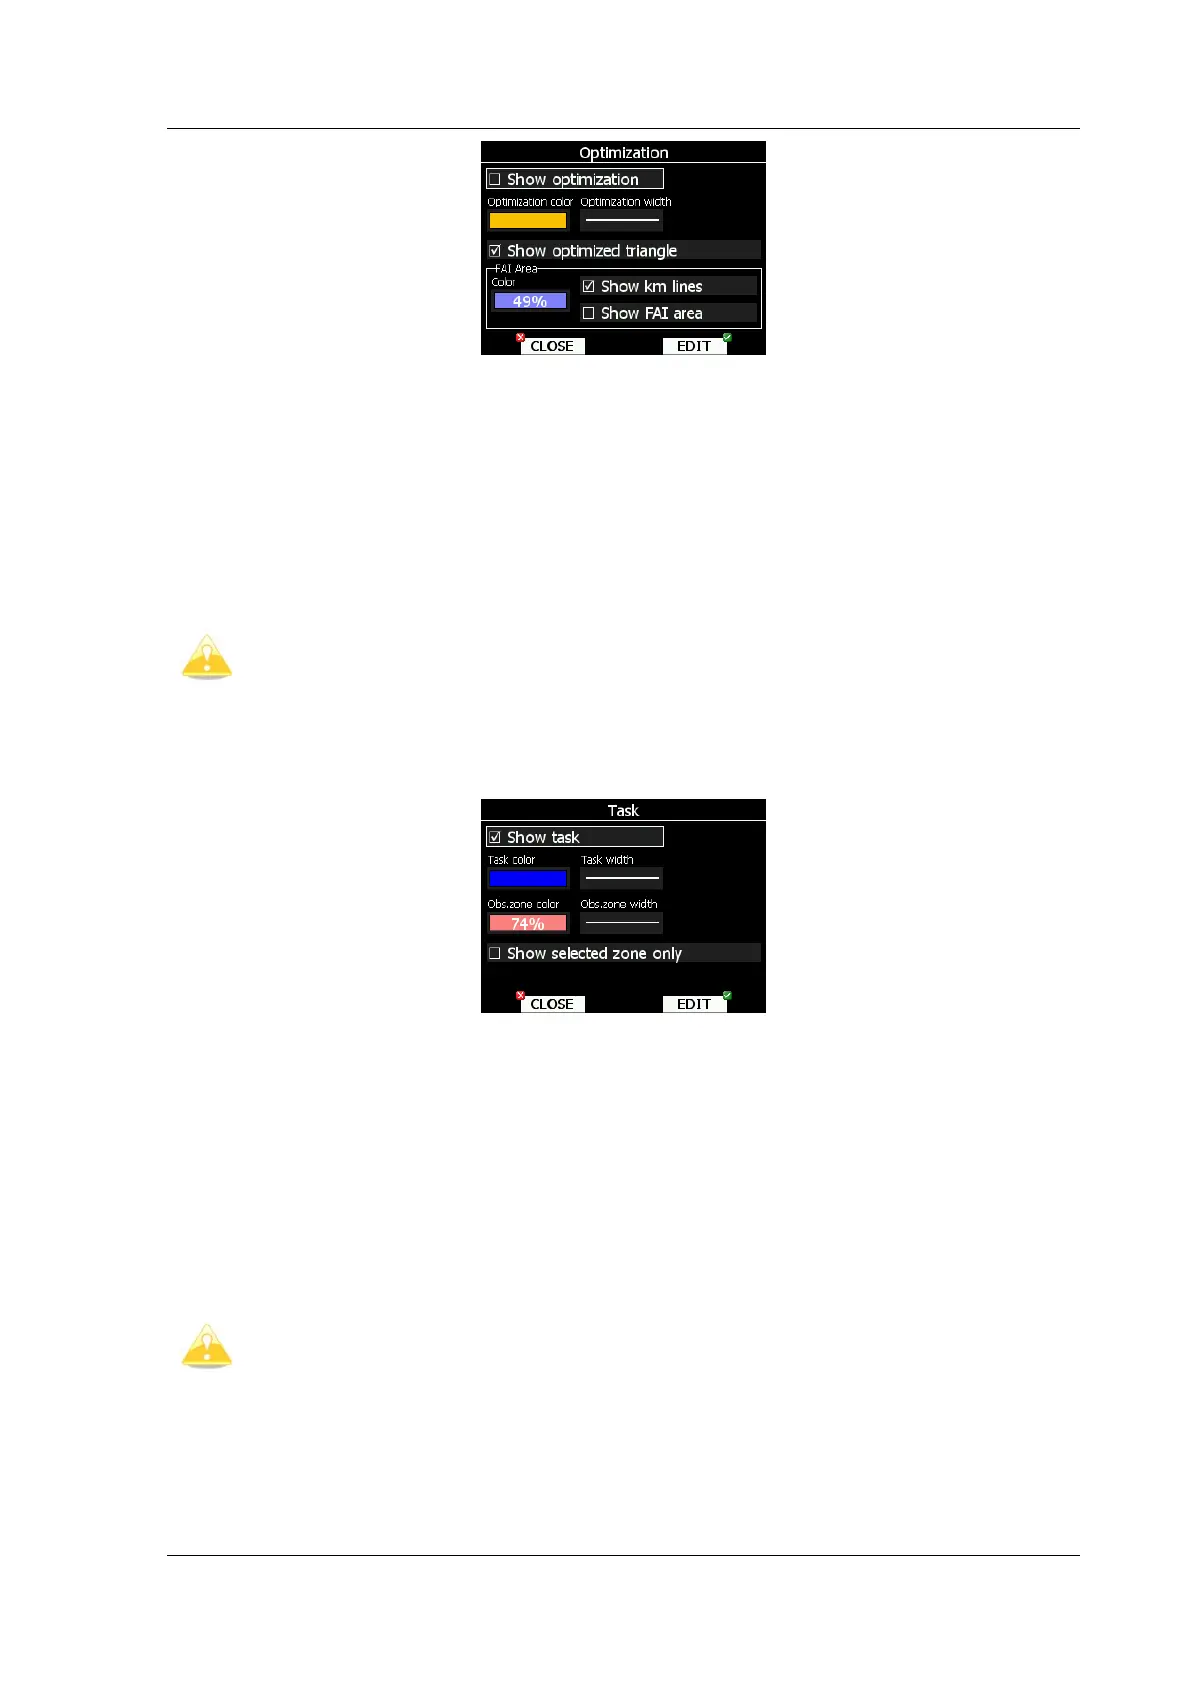
Check show optimization item to enable display of optimized track. Optimization color and
width defines color and width for these lines.
If Show optimized triangle is checked also lines for largest optimized triangle are shown.
Please note this might not be a triangle according to FAI rules.
FAI Area group defines how FAI area is drawn. Select Color item to change color of FAI
area. Use bottom-left knob to change transparency of area. 100% means completely
transparent and only outline will be drawn. 0% means completely solid. (Not recommended).
Check show km lines item to see lines which indicates, what will be size of completed
triangle.
These lines will always be plotted in kilometers scale regardless of Units setup.
5.1.6.6 Task
Use this dialog to setup how task is drawn in graphical pages.
If checkbox show task is not check, no task will be drawn. Task color defines color of task
lines. Observation zone color defines colors for observation zones. Use bottom-left knob
to change transparency of area. 100% means completely transparent and only outline will be
drawn. 0% means completely solid. (Not recommended).
Show selected zone only item controls if all task observation zones are to be displayed or,
if there is only one than that alone will be shown.
5.1.6.7 Flarm
Some LX8000 are equipped with FLARM module. If you instrument is equipped with FLARM
module, this menu will let you to modify presentation of Flarm radar display.
Flarm radar is not available if competition mode is switched on or privacy is
switched on. See chapter 5.1.13.4.